Warn-on-Forecast Case Studies
Wisconsin Blowdown Event, July 19, 2019
During the evening of July 19, 2019, a derecho occurred from far eastern Minnesota to eastern Wisconsin. It produced an extensive swath of damaging wind gusts across Wisconsin over the early evening before crossing Lake Michigan and weakening in western Lower Michigan overnight. Embedded swaths of significant severe winds (> 65 knots) were associated with two supercells, one early in the event and another that developed ahead of the growing mesoscale convective system (MCS), at its northern end. The event produced seven tornadoes combined across the state of Wisconsin, with the strongest tornadoes rated EF-1. The greatest extent of impactful severe weather from this event occurred near and southeast of the town of Rhinelander, Wisconsin, where the second supercell was overtaken by and merged with the MCS. In this region, a “blowdown” - a focused area of damaging straight-line winds that can blow down tens of thousands of trees in the Northwoods - occurred. This blowdown was the byproduct of an intense bookend vortex that developed within the supercell-MCS merger region.


WoFS was run in real-time for this event. Given the highly impactful nature of the blowdown, as well as the complexity of the supercell-MCS merger that led to the blowdown, this case has the potential to shed light on WoFS performance with complex storm interactions. Below is an overview of the event and how WoFS performed on this day.
Meteorological Synopsis

The Storm Prediction Center outlined a moderate risk for severe weather, with an expectation for potentially tornadic supercells to develop across central Minnesota and grow upscale as they traveled eastward into Wisconsin.


These storms were expected to develop within a stronger belt of mid-latitude westerlies located across the northern United States (see the 500mb chart from the evening of July 19 on the left above). Convective initiation occurred northeast of a surface low pressure across central Minnesota, with the bulk of convection remaining north of a warm front draped to the low’s east (see the Weather Prediction Center surface map on the right above).
Derecho Evolution
Initial storm mode was supercellular across eastern Minnesota, before convection grew upscale as anticipated. By the time the storms crossed into northwest Wisconsin they had become an MCS.

In the above radar loop, the second supercell can also be seen across north central Wisconsin, ahead of the MCS. WoFS members had some success anticipating the development of this supercell prior to its maturation - the 21:00 UTC run had 6 out of 18 ensemble members depicting a discrete supercell ahead of the MCS by 23:00 UTC, as seen in the “postage stamp” plot below.

This supercell matured near and north of the warm frontal zone, producing two EF-0 tornadoes around 0000 UTC west of the town of Rhinelander. As the MCS overtook the supercell from the west, a developing bookend vortex produced widespread 80+ mph winds. Radar evolution of this feature as well as the damage reports from the region can be seen in the images below.


Damaging Wind Forecasts
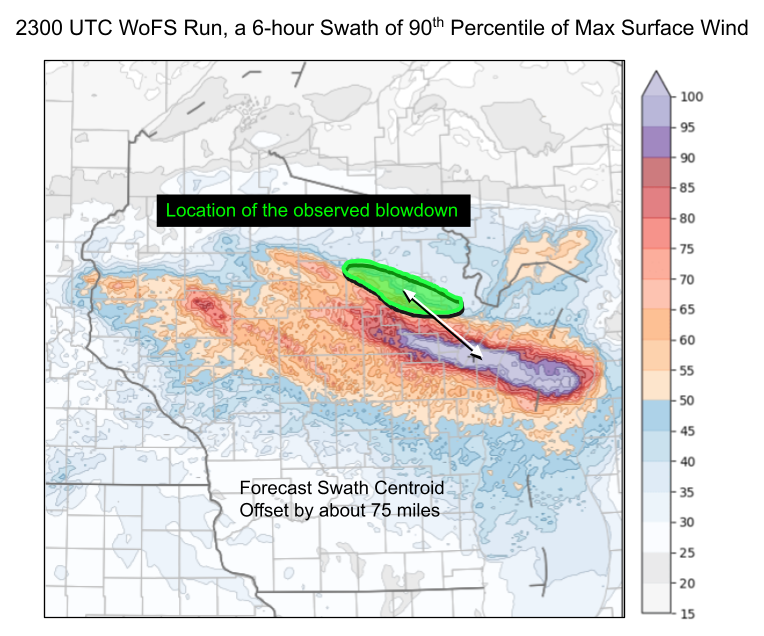
WoFS 90th percentile maximum wind gusts from the 2300 UTC run are shown above. This plot shows a defined swath of damaging wind potential across central and eastern Wisconsin. This swath aligned more with the bow echo apex in WoFS, whereas the real-world blowdown event took place farther north, in association with the bookend vortex. Although WoFS did a good job of signaling a narrow, high-end event, there is an offset of about 75 miles in the event centroid. North of the bow echo apex, WoFS had no pronounced signal for damaging wind gusts. A look at the example of WoFS forecasted reflectivity suggests why this was the case. In both the 2300 and 0000 UTC runs WoFS members progressed the supercell toward the southeast, wrapping it into the MCS in a delayed fashion and farther southeast than the merger occurred in reality. The eventual evolution into a damaging rear-inflow jet and bookend vortex was well represented in some of these members, though displaced in location, as seen in the loop below.

Other WoFS members weakened the supercell prior to its merger with the MCS. In weakening the supercell, those members did not slow the supercell as much as the real-world storm did during its mature phase. Therefore, there was no storm merger within many WoFS members, and no development of a bookend vortex.
Damaging Wind Potential

![[+]](/projects/wof/casestudies/wisconsin-jul2019/img/Early_Rhinelander_RadarLoop.gif)
The 7:00pm CDT surface analysis here from the Weather Prediction Center (lower left) along with the WoFS 2-meter temperature and winds (upper right) show how the derecho straddled a synoptic warm front (the storms seen in the upper left panel are mirrored by the dark splotches in the two right-hand panels which represent NSSL’s Multi-Radar Multi-Sensor location of the real world storms). Note that the supercell and eventual supercell / MCS merger occurred to the cool side of the warm front. The environment likely contained significant differences from north to south across the warm front, and we can examine these differences using WoFS forecast soundings. Sounding locations are indicated in the upper left image above, and the 700 mb moisture (dewpoint) plot in the lower right will be relevant to our analysis. The two soundings, which are shown below, are valid at 7:40pm CDT, 40 minutes into the WoFS forecast, the same time at which we are displaying the WoFS output above.


Given that the soundings were valid near 8:00 p.m. local time, once diurnal cooling had begun, evidence of a stable surface layer can be seen at both locations. However, there are noteworthy differences above the surface layer. Within the bookend vortex region, the area above the surface layer up to 850 mb is considerably drier and displays adiabatic lapse rates. In the bow echo region, this same layer is very moist and lapse rates are not quite so steep. Yet, as we move up to between 800 mb and 600 mb it is the bow echo region that becomes considerably drier. Note also that the shear (0-1 km Storm Relative Helicity or SRH) versus instability (MLCAPE) scatter plots at the lower right side of each sounding show remarkably different environments. The bow echo region has much larger shear and instability values. Thus, it may not be surprising that tornadoes occurred along the bow echo apex, and did not occur farther north. In terms of damaging wind, however, the factors seen in the soundings are conflicting. The larger instability and drier mid levels of the bow echo region should promote strong outflow, but the more moist profile near the surface is less favorable for bringing the full force of that outflow to the ground. On the other hand, the sharp dryness and adiabatic lapse rates just above the surface layer in the bookend vortex region is very favorable for bringing wind to the ground within downdrafts. Hence, maybe there is some signal here from the WoFS soundings to expect greater wind gusts in the bookend vortex region, especially given the influence of the vortex itself. At the very least, this analysis shows that WoFS is capable of aiding forecasters in interpreting starkly contrasting environments only a few short miles away from each other.
Predicting Wind Placement and Magnitude
We can overlay our analysis of local storm report isotachs (lines of constant wind speed) on WoFS plots of 90th percentile of max surface wind to get a sense of how WoFS performed.

WoFS 90th percentile of maximum surface wind, with the local storm reports at 2100 UTC [+]

The same 2100 UTC forecast shown side-by-side with the 2300 UTC forecast [+]
The images above show the WoFS 90th percentile of maximum surface wind, with the local storm report wind speeds contoured at 50, 60, 65, and 80 knots. The timing of the derecho corresponds best to the 6-hour swath forecast from 2100 UTC, shown in the initial stand-alone image. The same 2100 UTC forecast is then shown side-by-side with the 2300 UTC forecast. By 2300 UTC, some of the event had already passed, so we also plot the beginning and end location of the derecho for each respective forecast run. The bulk of the derecho occurred within the swath of predicted severe winds (severe wind speeds are in orange, red, and purple). These 90th percentile plots also clearly highlighted corridors of enhanced wind speed. The 2100 UTC forecast predicted the possibility of 80-110 knot winds in a narrow swath just downstream from where multiple 80-knot winds were reported in western Wisconsin. By the 2300 UTC run, WoFS had trended toward indicating a swath of similarly intense winds at the northern end of the system, near where the blowdown occurred. The forecasts are not perfect by any means; WoFS was too slow to initiate the earlier swath, and never was able to place the bookend vortex / blowdown event far enough north. But the signal of extreme wind speeds was useful to the Storm Prediction Center who listed 90 knot winds in a rare “Particularly Dangerous Situation,” PDS, Severe Thunderstorm Watch issued at 2250 UTC. The highest observed wind speed that evening was 87 knots.
WoFS Takeaways
WoFS performance in the July 19, 2019 blowdown is promising, especially for using WoFS to identify a potentially high-impact scenario within a supportive environment. The county-level details on which WoFS struggled in this case may indicate that finer grid resolution will be needed to handle complex storm mergers and interactions. The WoF group has already begun development of the next generation WoFS, with research starting at 1 km grid spacing (the current WoFS uses 3 km grid spacing). WoFS well-handled the development and merger of convection into an MCS across eastern Minnesota and western Wisconsin. There were also signals of an intensifying bookend vortex and associated swath of high-end wind speeds in WoFS forecasts later in the evening. The placement was not perfect, but represented an accurate representation of what the environment was capable of producing that evening. Output like this influenced the Storm Prediction Center to reach for 90 knot winds in the text of a severe thunderstorm watch.
The county-level details were quite challenging. Although it was a minority of ensemble members, some did depict the supercell ahead of the northern end of the MCS prior to its intensification and subsequent tornado production. Once the supercell had matured WoFS members varied in their handling of the storm’s motion and interaction with other nearby convection. In WoFS the supercell-MCS merger and development of a damaging bookend vortex was eventually depicted at short lead time, but was displaced to the south and east. The intensity of winds predicted in the 90th percentile products were accurate, though, in depicting the possibility of extreme winds greater than 80 knots. Analysis of the environment via WoFS forecast soundings, combined with a knowledge of ongoing radar trends, could hypothetically have aided forecasters in anticipating the strong damaging winds contained within the bookend vortex, in an area that is prone to blowdown events.