
Warn-on-Forecast Case Studies
Nocturnal Tornado Outbreak in Tennessee, March 2–3, 2020
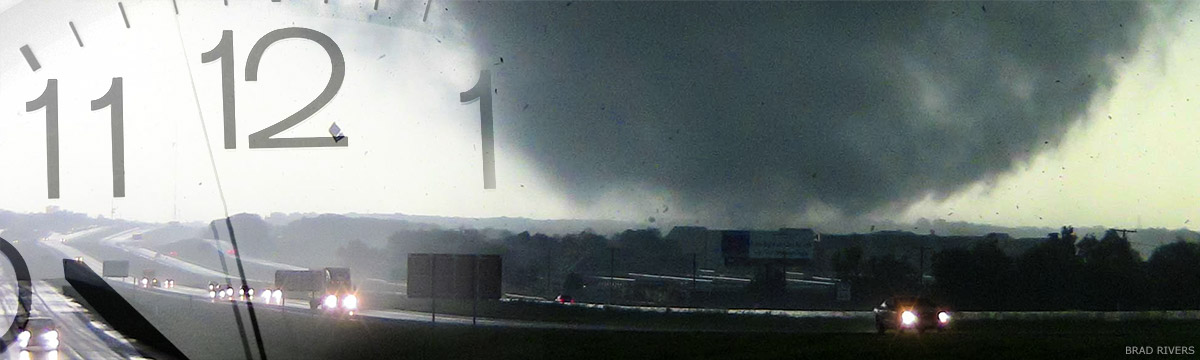
During the overnight hours on March 2-3, 2020, a tornado outbreak occurred across northern Tennessee. The outbreak included several tornadoes that resulted in fatalities and numerous injuries. The two tornadoes with the highest ratings on the Enhanced Fujita (EF) Scale impacted the Nashville metropolitan area just before 1:00 am CST at EF3 intensity (5 fatalities and 220 injuries) and Cookeville just before 2:00 am CST at EF4 intensity (19 fatalities and 87 injuries). Severe weather forecasts issued by the Storm Prediction Center indicated a Slight Risk for severe thunderstorms in the Mississippi valley extending east through Tennessee during the overnight hours. One of the forecast challenges for this case and nocturnal tornado events in general is anticipating how long into the overnight hours the favorable ingredients for tornadoes last. During this event, the atmospheric conditions remained favorable for intense thunderstorms and tornadoes into the early morning hours across Tennessee. A supercell thunderstorm formed in western Tennessee at 9:30 pm CST and went on to produce 13 tornadoes across Tennessee, including the deadly Nashville and Cookeville tornadoes.
WoFS was not run in real time for this event, but a retrospective WoFS forecast was generated after the event in order to test if WoFS would have had the potential to provide useful real-time information to forecasters as the event unfolded. Below is an overview of the event and how WoFS performed on this day.
Meteorological Setup
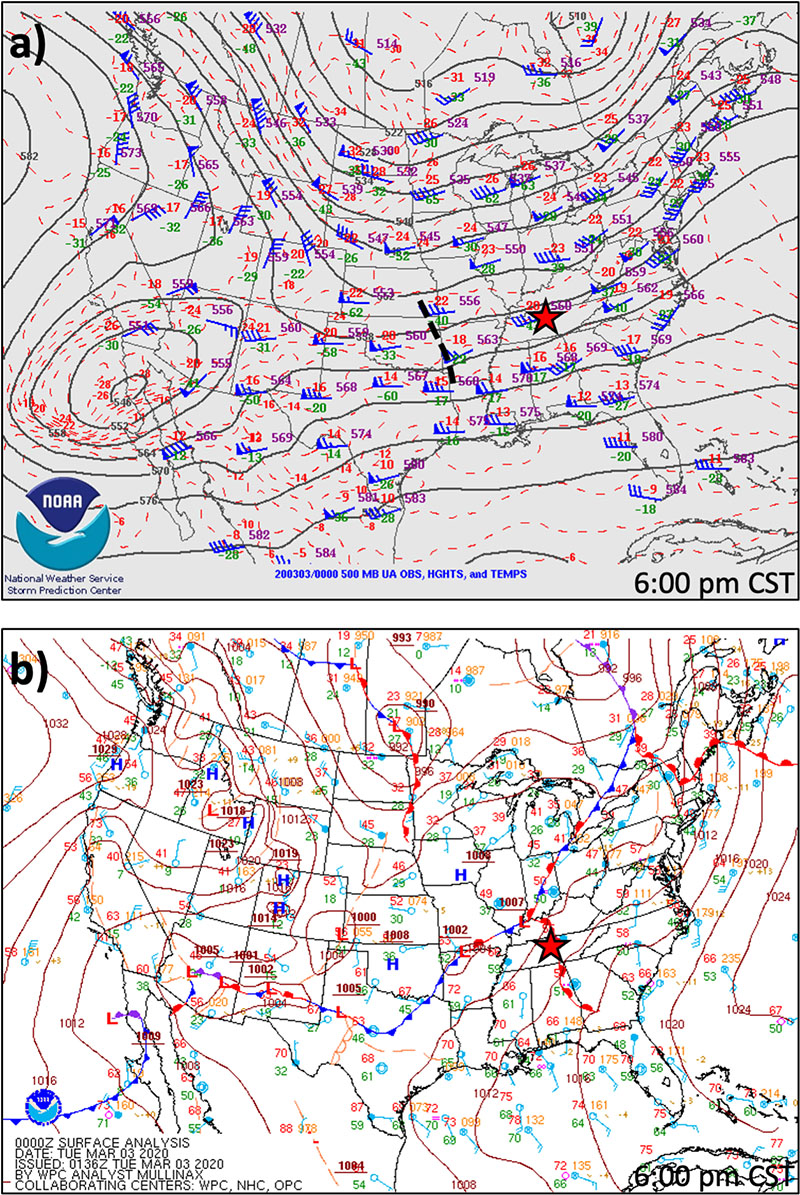
The upper-level chart at 500 mb (approximately 18,000 feet above sea level) at 6:00 pm CST on March 2 shows strong southwesterly winds across the central and eastern United States. Large troughs of low pressure are located in the northern Great Plains and Great Lakes region and also over Baja California. A smaller trough of low pressure is located in eastern Oklahoma and western Arkansas and is marked by the black dashed line. At the same time, a surface low pressure system was located from northern Arkansas to northwest Kentucky with a cold front extending southwest into Oklahoma and Texas and a warm front extending south-southeast through Tennessee. Surface air temperatures in the warm sector (the region between the cold and warm fronts) of this low pressure system were relatively cool compared to what might be expected for a tornado outbreak, ranging from the mid 60s to low 70s Fahrenheit across Arkansas and western Tennessee. However, very cold temperatures at upper levels near -20 Celcius (-4 Fahrenheit) at 500 mb, allowed for an unstable environment that favored thunderstorm formation. Strong winds in the atmosphere associated with the small trough of low pressure at upper levels helped to increase the vertical wind shear (the change in wind speed and direction with height) in the warm sector, which is favorable to severe storms and tornadoes.
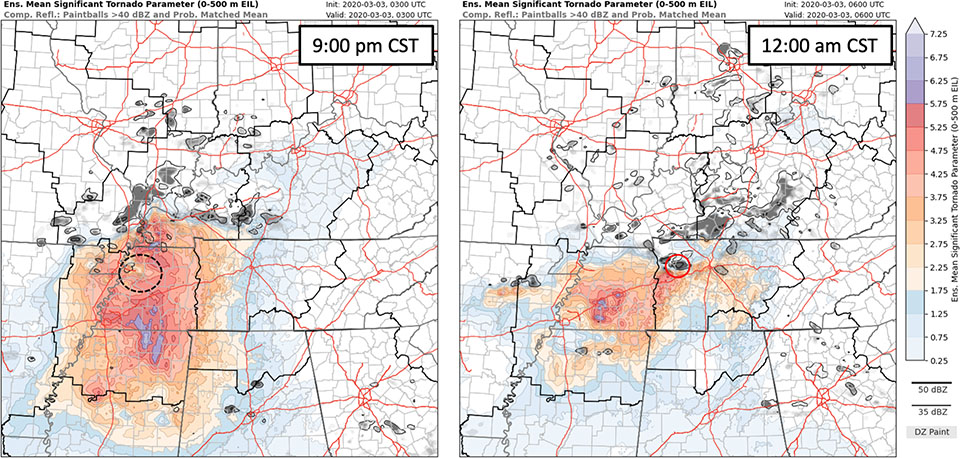
This image shows the WoFS analysis significant tornado parameter (STP) computed using an effective inflow layer of 0-500 m above ground at (left) 9:00 p.m. March 2 and (right) 12:00 a.m. March 3. The colored shading shows that all of western Tennessee had a high STP at 9:00 p.m., indicating an environment that favors supercell storms and tornadoes. The black contours represent where the storms are, on average among the 18 members of the WoFS ensemble, and it shows that storms are just beginning to develop in western Tennessee. The key region is marked by the black-dashed circle. By 12:00 a.m., the high STP environment expanded east through the Nashville area and the supercell storm (red circle) is located in this environment that is favorable for tornadoes. The life cycle of the supercell storm is examined in more detail in the next section.
Long-lived Supercell
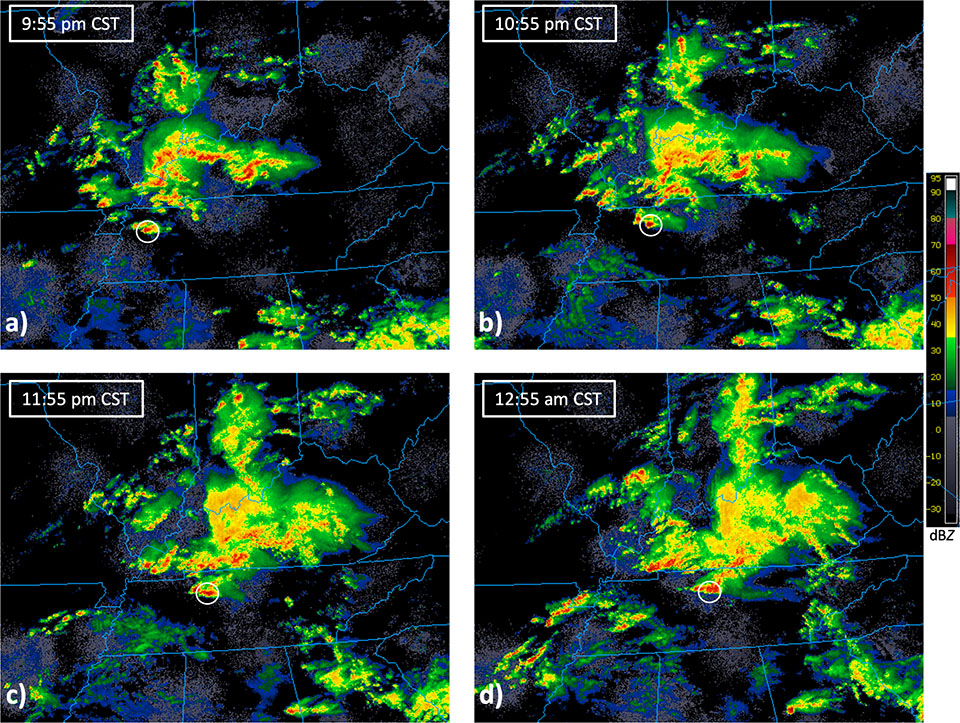
This sequence of images shows radar reflectivity (a measure of precipitation intensity) for the Mississippi, Tennessee, and Ohio valleys for 9:55 pm on March 2 through 12:55 am on March 3 (image courtesy of UCAR and College of DuPage). The supercell thunderstorm responsible for the tornadoes in Tennessee is located in western Tennessee at 9:55 pm (white circle in each panel) and tracks eastward through the Nashville area by 12:55 am CST.
This is a loop of radar (left) reflectivity and (right) velocity from 12:25-1:11 a.m. March 3 as the supercell moved through the northern part of the Nashville metropolitan area (imagery courtesy of RadarScope Pro). The location of the Doppler radar is marked by the black dot near Green Hill. The reflectivity shows a classic “hook echo” signature as the supercell approaches Nashville, and indicates that the thunderstorm is rotating on its southwest side. The velocity shown in the right panel also indicates this signature for rotation near the ground. In this image, red colors represent winds blowing away from the Doppler radar and green colors represent winds blowing toward the Doppler radar. This image shows that the red and green colors blend together, which is an indicator of rotating winds in the storm, in the same location of the hook echo signature that is shown in the left panel.
WoFS forecast from 10:00 pm March 2
This is a loop of a WoFS forecast valid from 10:00 pm March 2 through 1:00 am March 3. The colored shading represents the probability of updraft helicity in the 0-2 km layer above the ground exceeding 20 m2 s-2. Updraft helicity is a parameter we calculate that indicates storm rotation. The black contours represent where the storms are on average among the 18 members of the WoFS ensemble. This WoFS forecast shows high probability (> 80%) that a storm with strong rotating winds will move east along Interstate-40 and impact Nashville between 12:30 and 1:00 a.m. on March 3. Given the typical latency of the WoFS output, this forecast would have been available to forecasters by 10:30 p.m., 50 minutes prior to the tornado watch issued for the Nashville area by the Storm Prediction Center and 2 hours and 45 minutes prior to the tornado reaching Nashville.
Comparison of WoFS forecasts
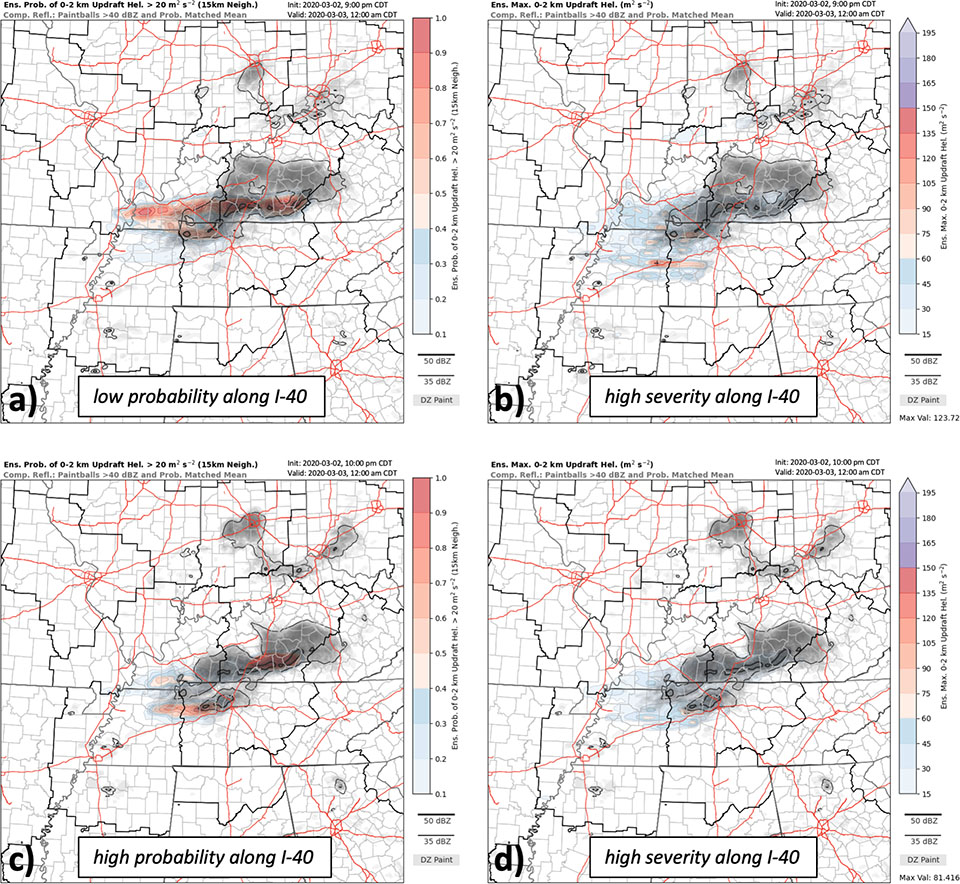
These are WoFS forecasts valid (top) 9:00 pm March 2 through 12:00 am March 3 and (bottom) 10:00 pm March 2 through 12:00 am March 3. In the left column, the color shading shows the probability of updraft helicity in the 0-2 km layer above the ground exceeding 20 m2 s-2. In the right column, the color shading shows the ensemble maximum updraft helicity in the 0-2 km layer above ground. The ensemble maximum value provides a measure of potential severity (higher values means stronger rotation). The top row represents a WoFS forecast initialized at 9:00 p.m., prior to the development of the supercell that produced the tornado outbreak in Tennessee. This forecast is characterized by a low probability event along Interstate-40, with 10% of members forecasting a supercell storm in the region. The ensemble maximum, however, indicates a high value of updraft helicity in the 0-2 km layer along Interstate-40. This forecast can be interpreted as a low probability/high severity forecast scenario. For the forecast initialized at 10:00 p.m. (bottom row), after the supercell formed, the forecast changed to a high probability/high potential severity forecast scenario.
While earlier WoFS forecasts indicated a low probability of a supercell storm approaching Nashville after midnight, the forecasts still provided information on the potential severity of the event. Then, once the supercell forms and is included in the WoFS initial conditions, the high probability, high potential severity scenario becomes apparent for areas along Interstate-40 and farther east. This is the type of evolving forecast information that WoFS can provide to forecasters that are working to develop potential forecast scenarios as a difficult nocturnal severe weather event unfolds.