
Warn-on-Forecast Case Studies
Hurricane Sally Landfall: Sept 15–16, 2020
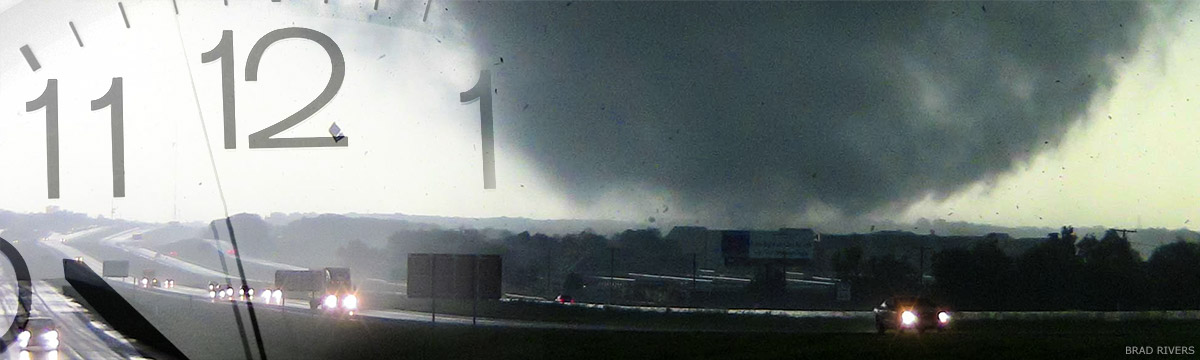
Early during the morning of September 16, 2020, Hurricane Sally made landfall just east of Gulf Shores, Alabama, as a slow-moving category 2 hurricane. Sally caused several billions of dollars in damage and resulted in nine fatalities. The region between Mobile, Alabama, and Pensacola, Florida, received the greatest impacts as dozens of training supercells embedded in rainbands in the right-front quadrant of the storm produced torrential rain and two EF-0 tornadoes. Nearly 30 inches of rain was reported at Orange Beach, Alabama, and rainfall totals over 2 feet were reported in Pensacola, Florida. In addition to the tornadoes and extreme rains, the eyewall contained destructive winds with multiple observed gusts in excess of 100 mph, and portions of southeastern Alabama were inundated by a 7–9 foot storm surge. NSSL provided real-time WoFS runs for this event on September 15th as Sally approached land and on September 16th as Sally moved inland through Alabama. These forecasts allowed us to examine how the WoFS ensemble performed in forecasting the meteorological hazards (damaging winds, excessive rainfall, and tornadoes) associated with a landfalling tropical cyclone.
Meteorological Setup
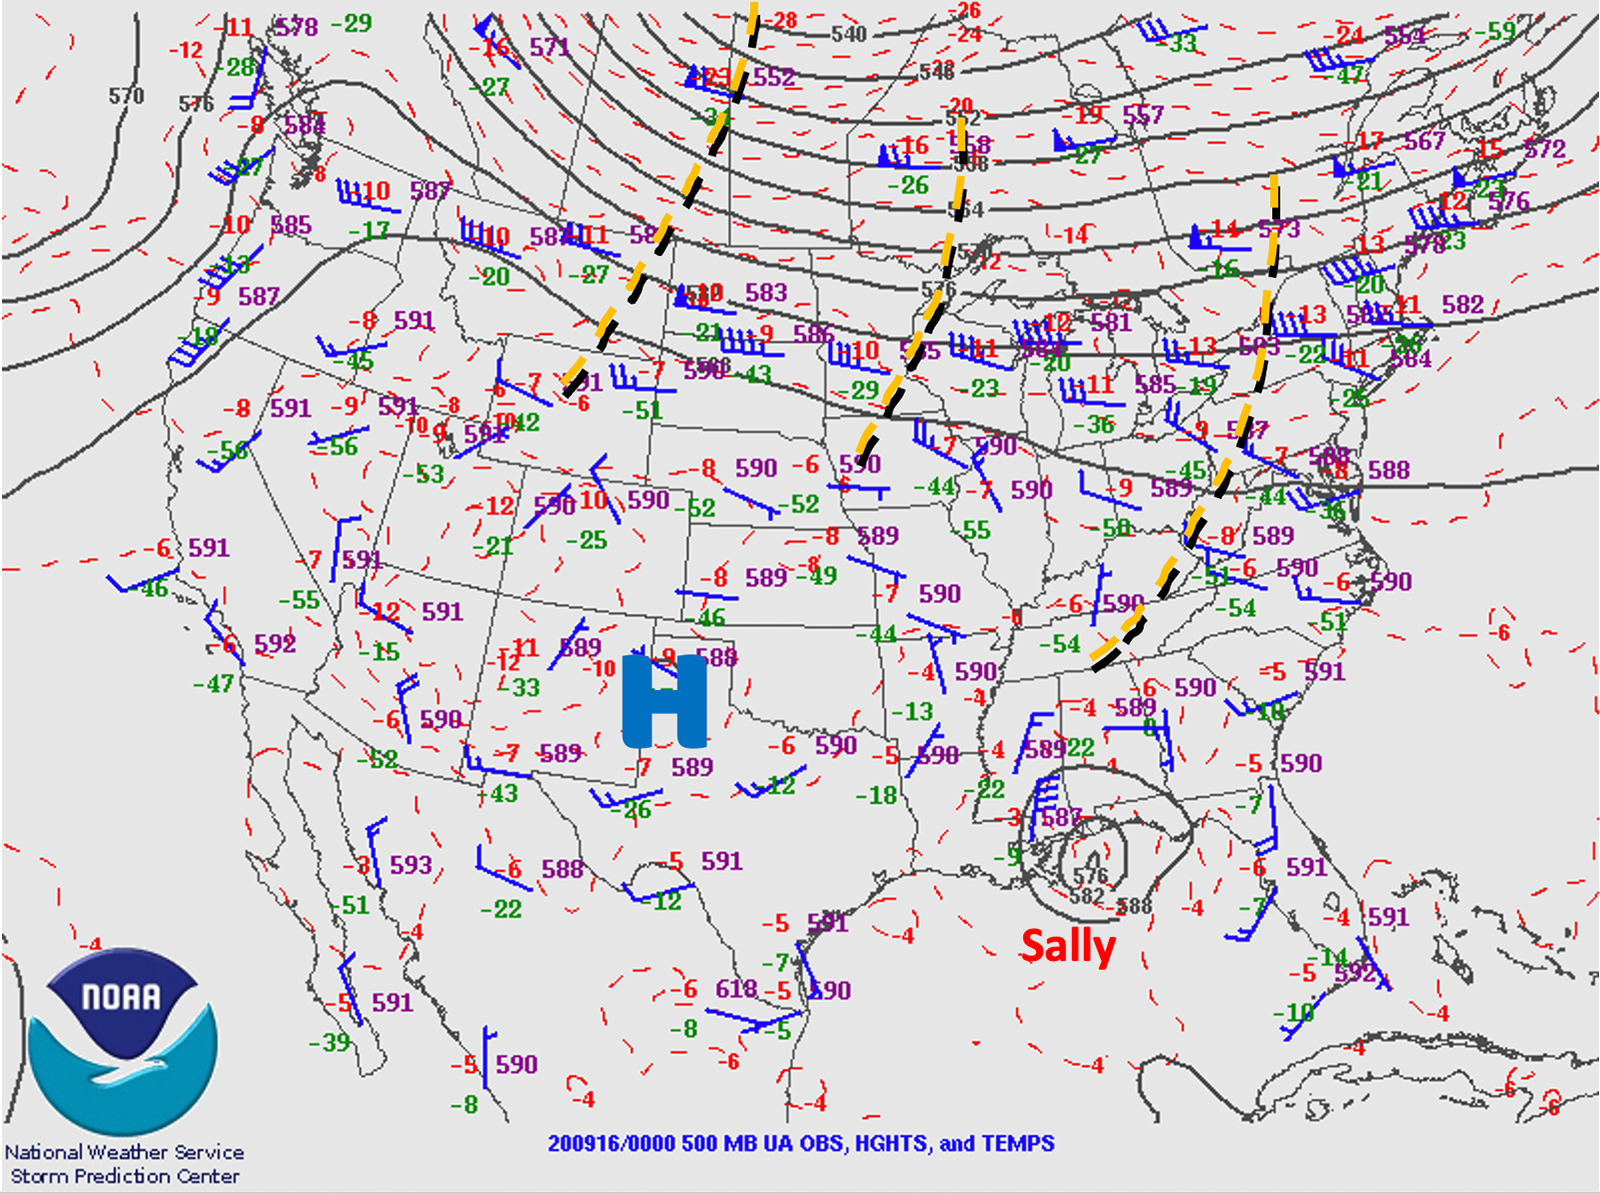
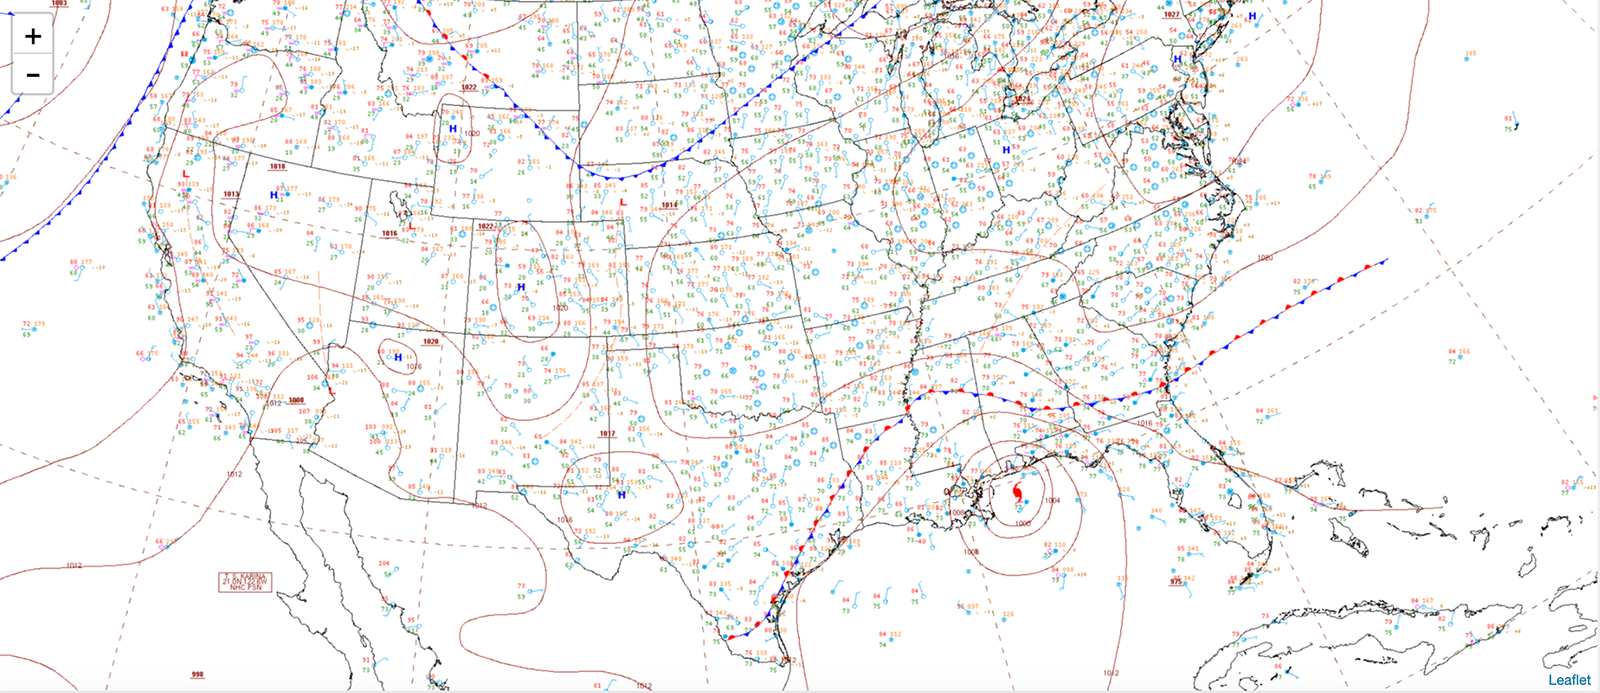
Above are the 500 mb (mid levels of the atmosphere) analysis (Storm Prediction Center, with hand-drawn features added) and surface analyses (Weather Prediction Center) valid at 8pm EDT on September 15, 2020, just hours prior to Sally’s landfall. Broad ridging at 500mb yielded favorable conditions for Sally to make a slow landfall, while the presence of upstream troughs over the northern tier of states that were digging into the eastern U.S. provided some impetus for Sally to turn northeastward.
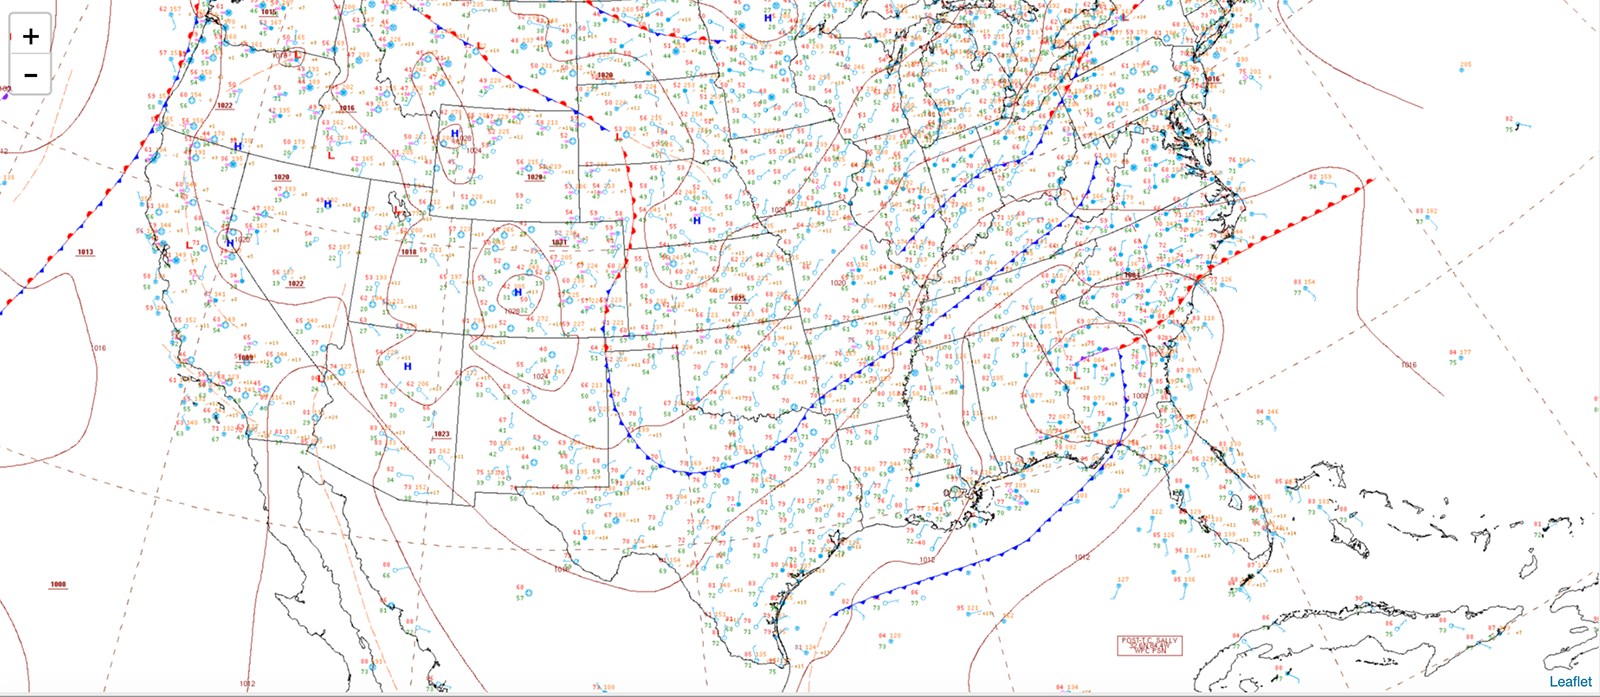
The surface trough in the east had laid down a quasi-stationary front, draped through the Gulf Coast states, with surface high pressure sprawling across the east coast and Ohio and Tennessee Valleys. These features would act to limit Sally’s northward component of motion, and eventually contribute to its loss of tropical characteristics, as seen in the surface analysis from 11am EDT on September 17, above.
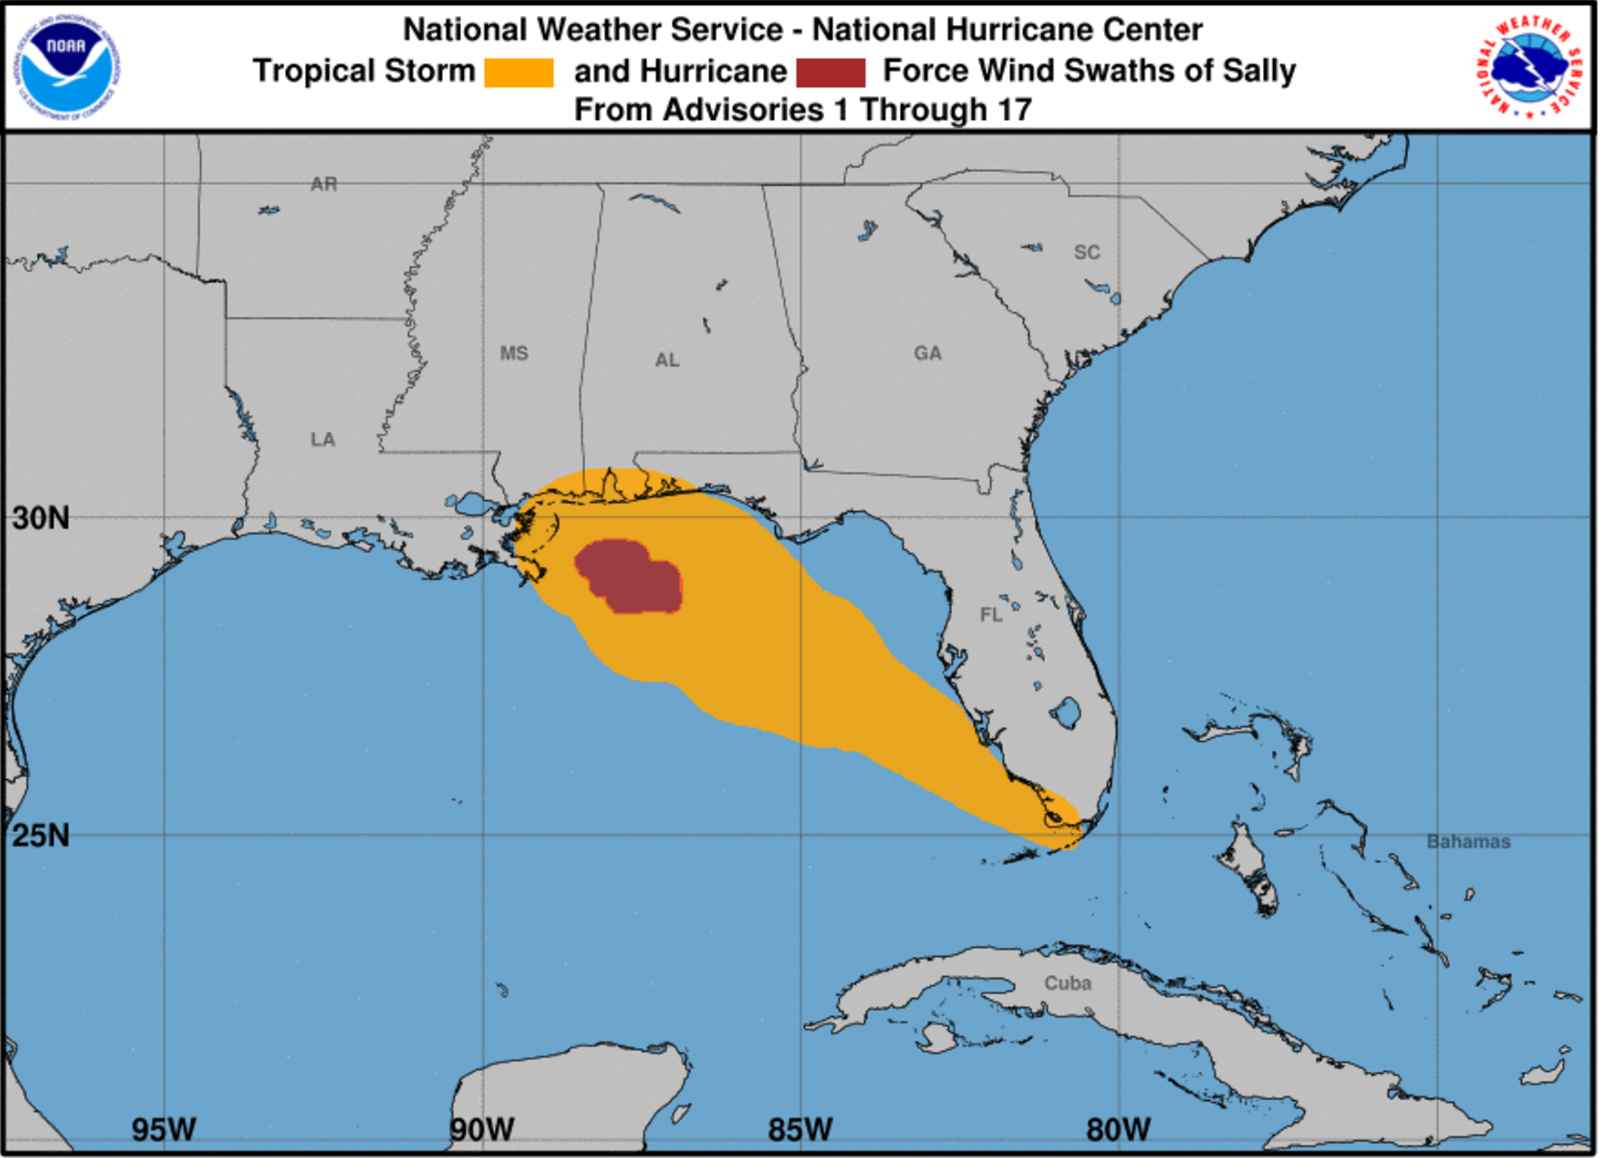
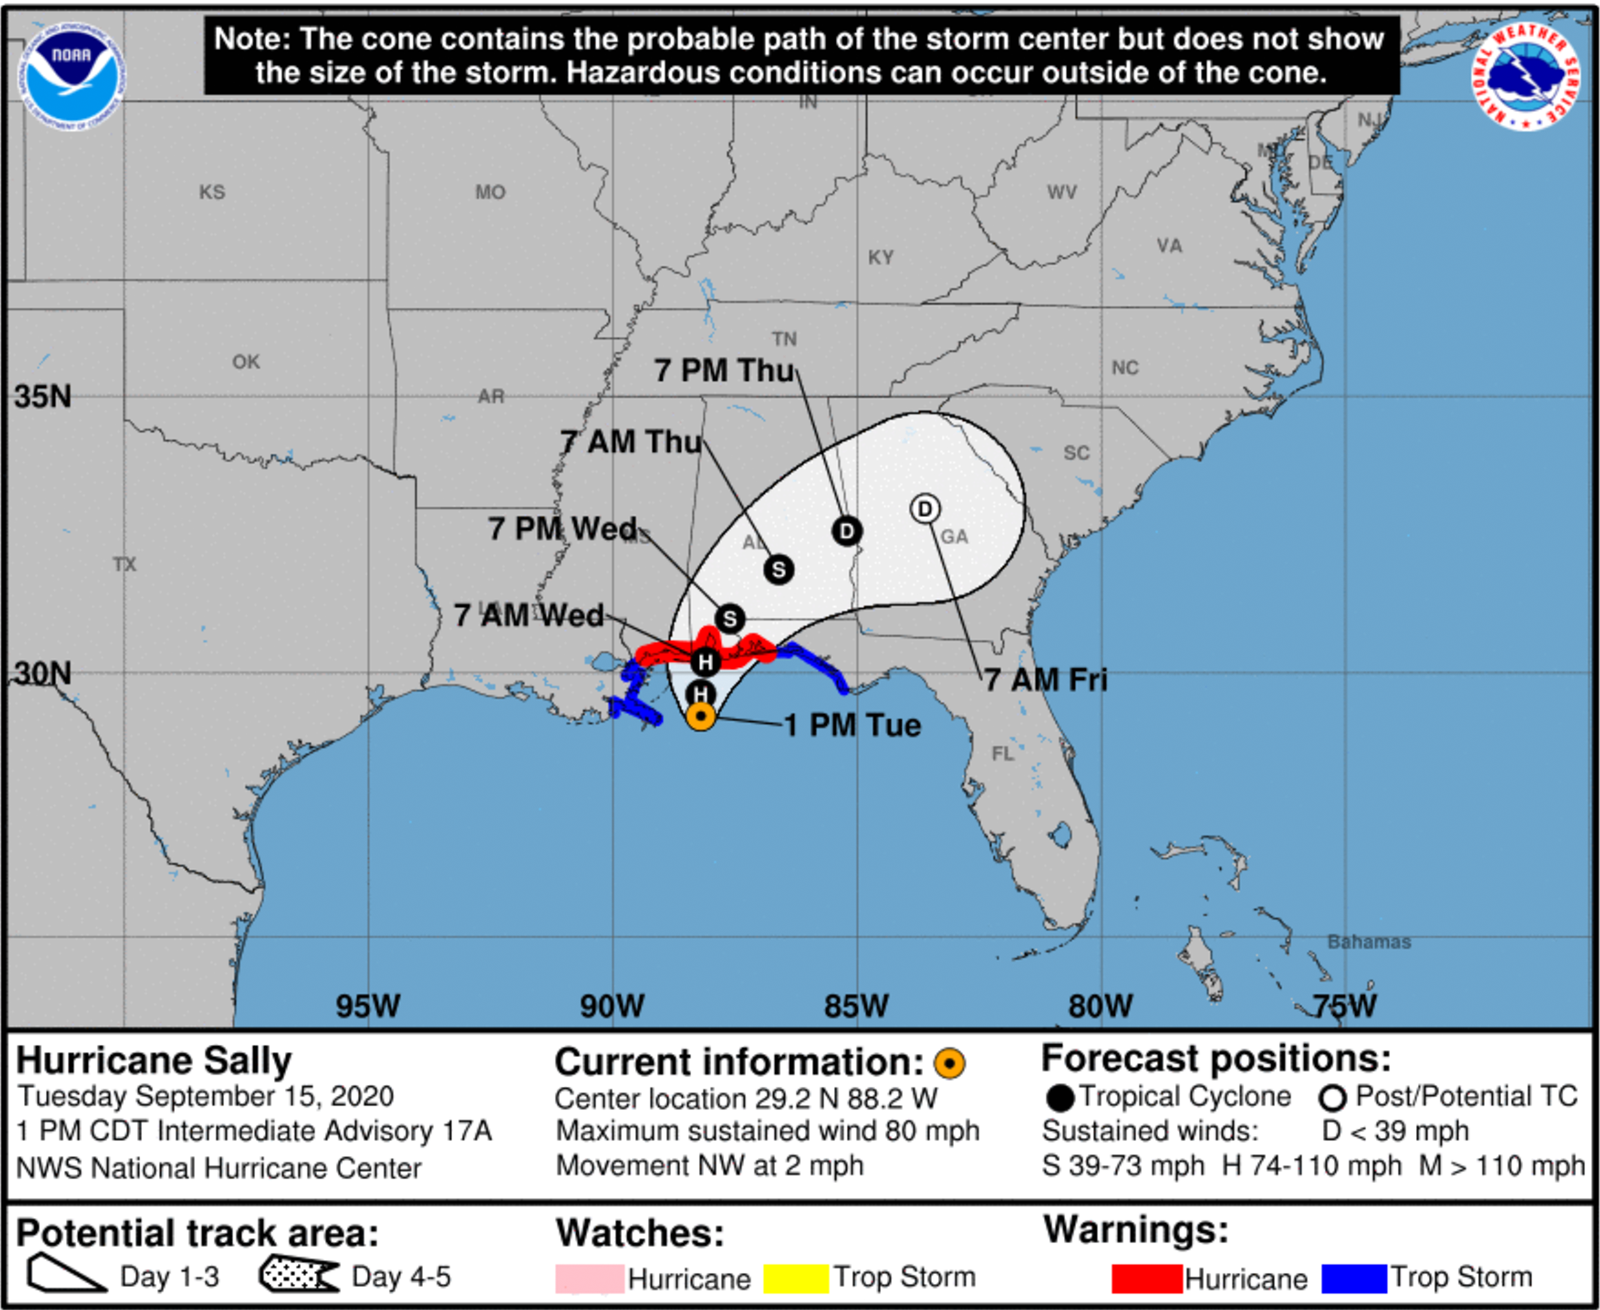
The above images show the wind history and forecast cone for Hurricane Sally from the National Hurricane Center’s (NHC) 2pm EDT advisory package on September 15, 2020. Sally had strengthened to a category 1 hurricane over the warm Gulf waters, with further intensification into a high-end category 2 hurricane occurring just prior to landfall. In earlier forecasts issued prior to September 15, NHC anticipated that Sally would continue to the northwest and make landfall between New Orleans, Louisiana, and Biloxi, Mississippi. Sally stalled offshore, however, giving time for an upper-level trough to progress into the eastern United States and steer Sally north-northeastward to Gulf Shores, Alabama. Rainfall was heavily concentrated on the eastern side of Sally, where training rainbands came ashore in southern Alabama and the Florida Panhandle. The hurricane then accelerated northeastward after landfall.
Rainfall Forecasts
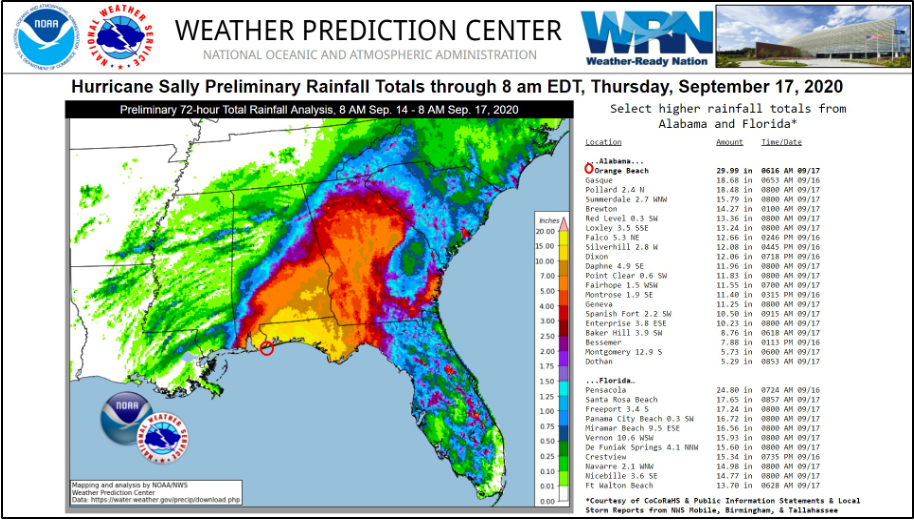
The above image shows the Weather Prediction Center’s preliminary summary of rainfall totals through 8am EDT on September 17, 2020. The highest rainfall total of 29.99 inches occurred at Orange Beach, Alabama, and is circled on the map.
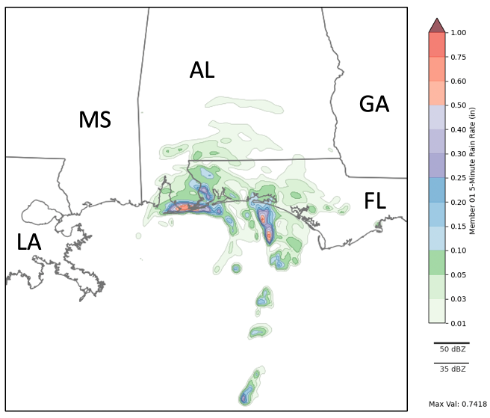
This image is a WoFS 5-minute rainfall rate forecast product issued at 11pm EDT on September 15 and valid at 4am EDT on September 16, about the time Sally’s eyewall reached shore. Five-minute rain rate is available on the QPF menu as a “member viewer” product, so forecasters can inspect loops from each of the 18 ensemble members. The image above shows the forecast from WoFS ensemble member #1. Many WoFS members suggested 5-minute rainfall totals of up to 0.50 inches, which if sustained would translate to 6-inch-per-hour rainfall rates. In addition to storm surge flooding, this information could increase confidence in freshwater flooding from extreme rainfall rates within the slow-moving hurricane.
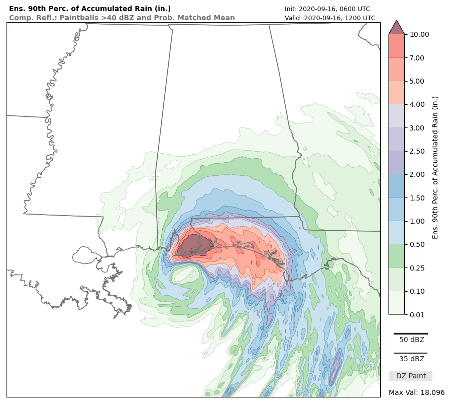
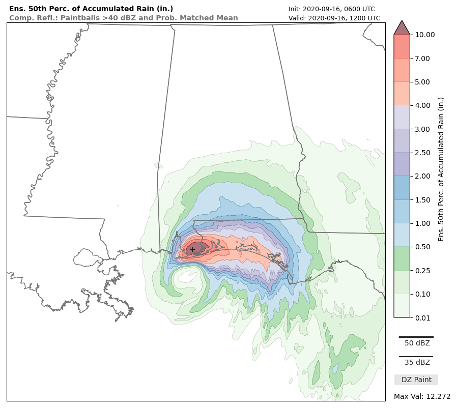
The WoFS 90th percentile rainfall amounts valid for 2–8am EDT on September 16 (shown on the left) highlight the anticipated excessive rainfall that would occur all along the coast in the Sally’s right-front quadrant. WoFS is not designed to forecast the full multi-day storm-total rainfall accumulations from a hurricane, but it can help forecasters pinpoint when and where the heaviest rainfall will occur over the next several hours. In addition to 6-hour forecast totals that exceeded 10 inches near the eyewall, this 90th percentile example indicates bands of embedded totals exceeding 7 inches over the western Florida panhandle where the primary rainband came ashore. This WoFS-forecasted rainband verified well versus radar and gauge observations near Panama City, Florida. While 90th and max percentile forecasts are typically used to think about worst case scenarios, the more conservative 50th percentile product also showed 5 to 10 inches of rain for the 2–8am EDT period. A small crosshair along the Alabama coast and the associated readout at the lower right of each image indicated a spot maximum of over 18 inches in the 90th percentile product, and over 12 inches in the 50th percentile product. Thus, forecasters could have high confidence that a foot of rain would occur in some locations over the next six hours, with potential for a foot and a half!
High Wind Forecasts
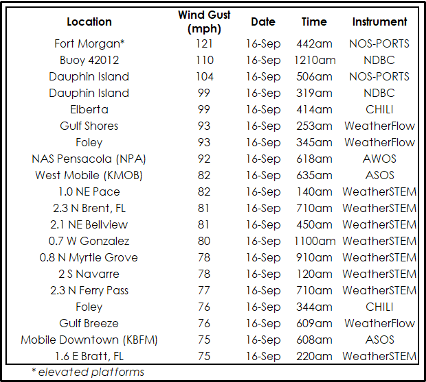
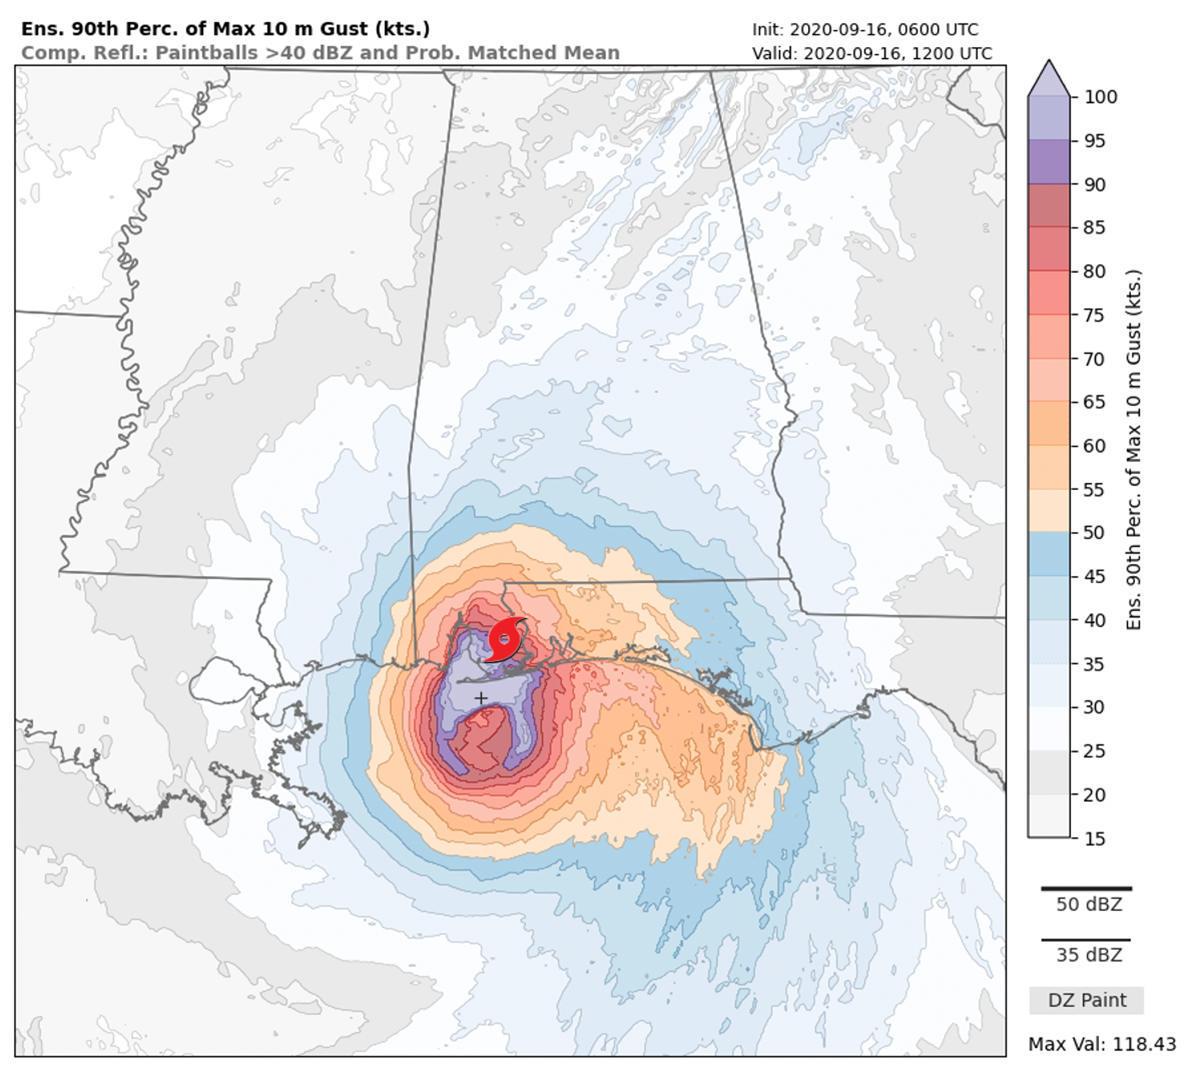
The images above show maximum reported surface wind gusts compiled by the NWS Forecast Office in Mobile, Alabama (left), and the WoFS ensemble forecast 90th percentile 10-meter wind gusts valid 2–8pm EDT on September 16 (right). The WoFS image covers the six hour period straddling landfall. The hurricane symbol plotted over the data indicates where Sally’s center was at the end of the 6-hour forecast, at 8am EDT. The highest observed wind gusts occurred at offshore buoys or at surface stations situated along the immediate coast. Similarly, the WoFS ensemble forecast 90th percentile 10-meter wind gusts showed a large region of 100+ knots along the coast and offshore near the point of landfall, with a maximum value among ensemble members of 118 knots just offshore. The WoFS wind gust values decreased sharply with inland extent and corresponded well with observations. WoFS forecasted 90th percentile wind gust values near 105 knots (120 mph) at the shoreline, which agrees well with the maximum recorded wind gust of 121 mph at Fort Morgan, Alabama. Forecast timing was equally accurate. WoFS runs initialized at 1am EDT and 2am EDT, respectively, forecast maximum wind gusts to occur at Fort Morgan, Alabama, near 5am EDT (the observed highest gust occurred at 4:42am), representing a lead time of around three hours for this site-specific forecast. WoFS also forecasted wind gusts in the 70–85 knot (80–97 mph) range in the nearby inland coastal zone, which agrees well with the 92 mph gust at Pensacola, Florida, and 82 mph gust at West Mobile, Alabama. WoFS, therefore, provided accurate forecasts of the maximum wind gusts that would be impacting the shoreline with several hours lead time.
Tropical Supercells & Associated Tornado Threat
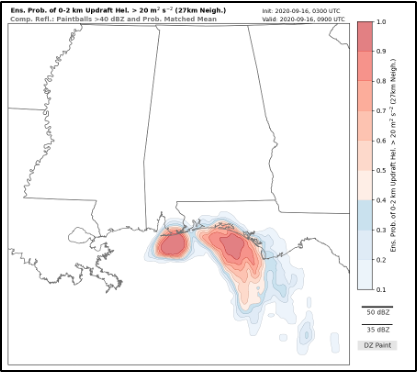
The images above show an annotated radar reflectivity loop from NWS Forecast Office in Tallahassee, Florida, near the time of Sally’s landfall (left), and the WoFS ensemble forecast probability of updraft helicity in the 0–2 km AGL layer exceeding 20 m2 s-2 valid at 11pm EDT September 15 through 5am EDT September 16 (right). The observed radar shows Sally’s eyewall located southwest of Pensacola, Florida, with rainbands just east of Pensacola and over Panama City, Florida. Tornado warnings, indicated by the red polygons that pop up at times during the loop, are issued for supercells embedded in the rainband near Panama City. The WoFS ensemble forecast shows high probabilities of rotating thunderstorms (i.e., supercells) with the two primary rainbands off of the Florida panhandle coast, with probabilities over 90% near Panama City. This WoFS forecast highlighted the tornado threat apparent with the supercell storms embedded in Sally’s rainbands. A second region of high probability in the WoFS forecast is associated with Sally’s northeastern eyewall. The probabilities decrease with inland extent, which is consistent with the tornado warnings issued and highlights how the tornado threat with Sally’s rainbands was limited to the immediate coastal zone.
WoFS Takeaways
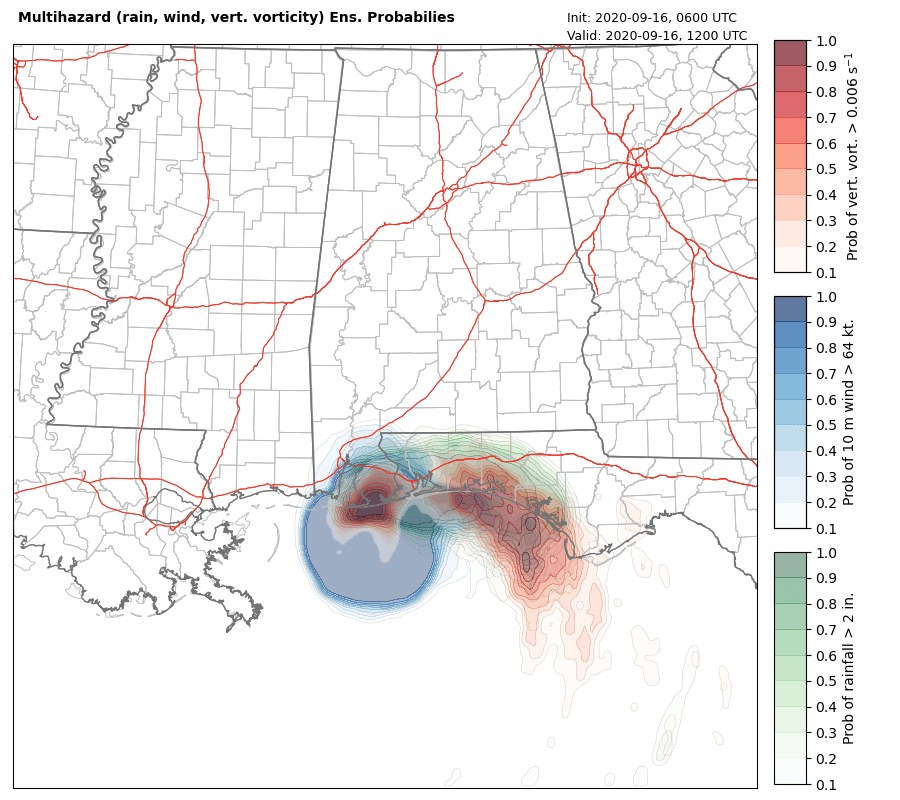
A landfalling hurricane provides an opportunity for unique applications of the Warn-on-Forecast System. Analyses of a number of recent events have shown WoFS does well at highlighting corridors of excessive rainfall and damaging winds, and is also able to flag tornado potential within rainbands. NSSL has also developed unique visualizations, such as the multihazard ensemble probability plot for the WoFS forecast valid 2–8am EDT on September 16 shown above, which may help forecasters quickly gain situational awareness as to which hazards are most threatening at a given time. In the Hurricane Sally case, WoFS picked up on rainbands on the east side of Sally that led to corridors of heavier rainfall and tornadoes. Additionally, the wind gust forecasts near the center of Sally were accurate. In all, WoFS was able to highlight the multiple hazards presented by Sally for the Alabama and Florida coastal zones. This and other events are helping to build confidence that WoFS can assist forecasters during tropical cyclone landfalls.