

Warn-on-Forecast Case Studies
Tornado Outbreak & Historic Flash Flood with Post‑Tropical Cyclone Ida, Sept 1–2, 2021
Hurricane Ida is the 6th costliest Atlantic hurricane in the United States on record. Ida devastated the Louisiana coastline as a category-4 major hurricane on the Saffir-Simpson Scale on August 29, 2021. After landfall, Ida moved northward into Mississippi and weakened to a tropical storm on August 30, and then moved northeastward reaching West Virginia as a post-tropical cyclone by 8:00 a.m. EDT on September 1.
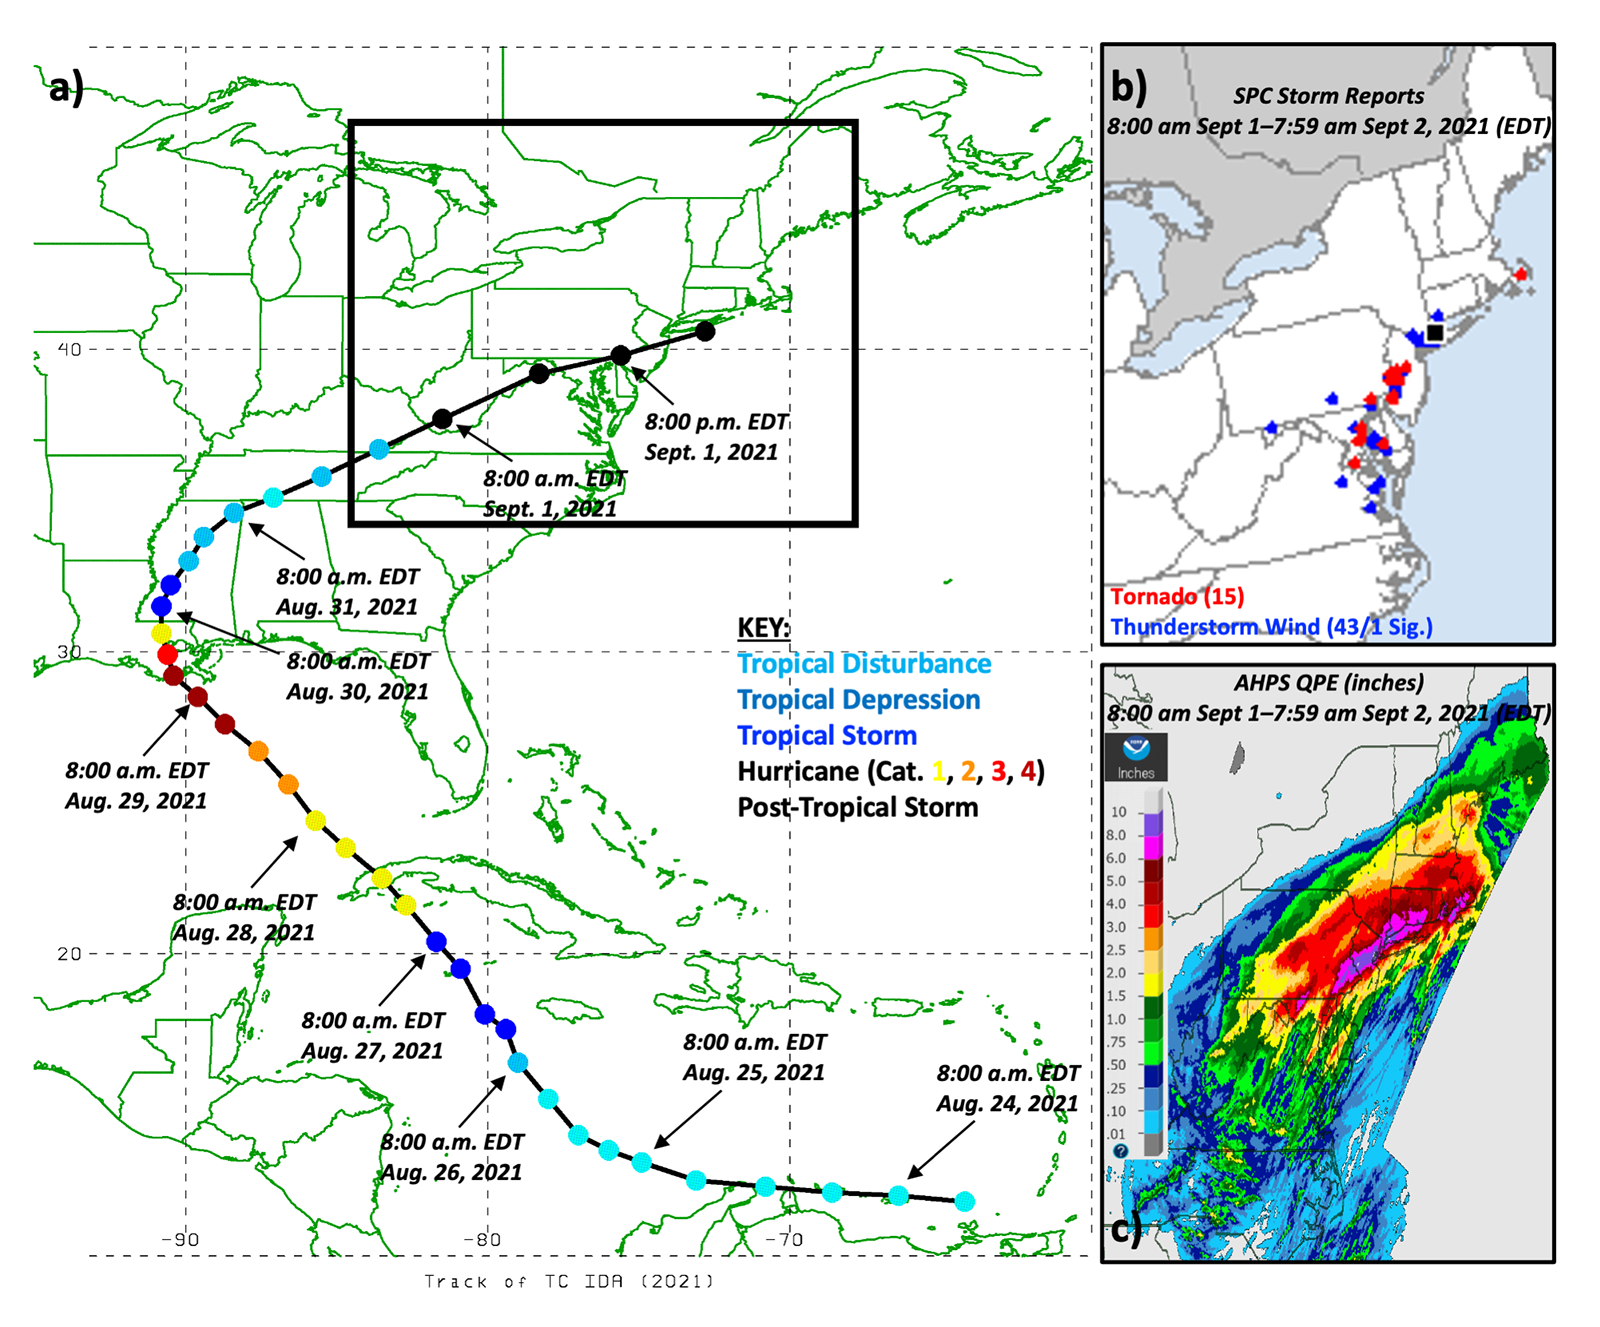
The figure above shows the track of Hurricane Ida marked with color-filled circles based on strength every six hours from its beginning near the northern coast of South America on August 24 through its impact on the Mid-Atlantic states and Northeast on September 1. In addition to its aforementioned impacts on the Gulf coast region, Ida produced 16 tornadoes from Maryland to Massachusetts (Storm Prediction Center tornado and wind reports shown in the upper right panel) and widespread extreme rainfall from Pennsylvania to New England (total rainfall in inches shown in the bottom right panel) on September 1. The tornadoes and flooding rains impacted the I-95 corridor beginning near lunchtime and extending through the late evening and overnight hours in southern New England. The tornadoes resulted in one fatality and numerous injuries in New Jersey and southeast Pennsylvania (near Philadelphia) while the historic flooding from Pennsylvania to Connecticut resulted in over 50 fatalities. A summary of the tornado reports and selected rainfall observations are provided in tables at the bottom of this case study.
WoFS was not run in real time for this event, but a retrospective WoFS forecast was generated in the days following the event in order to test if WoFS would have had the potential to provide useful real-time information to forecasters on the tornado and flooding threats as the event unfolded. This case represents a notable example of a multi hazard high-impact weather event. Below is an overview of the event and how WoFS performed on this day.
1. Meteorological Overview
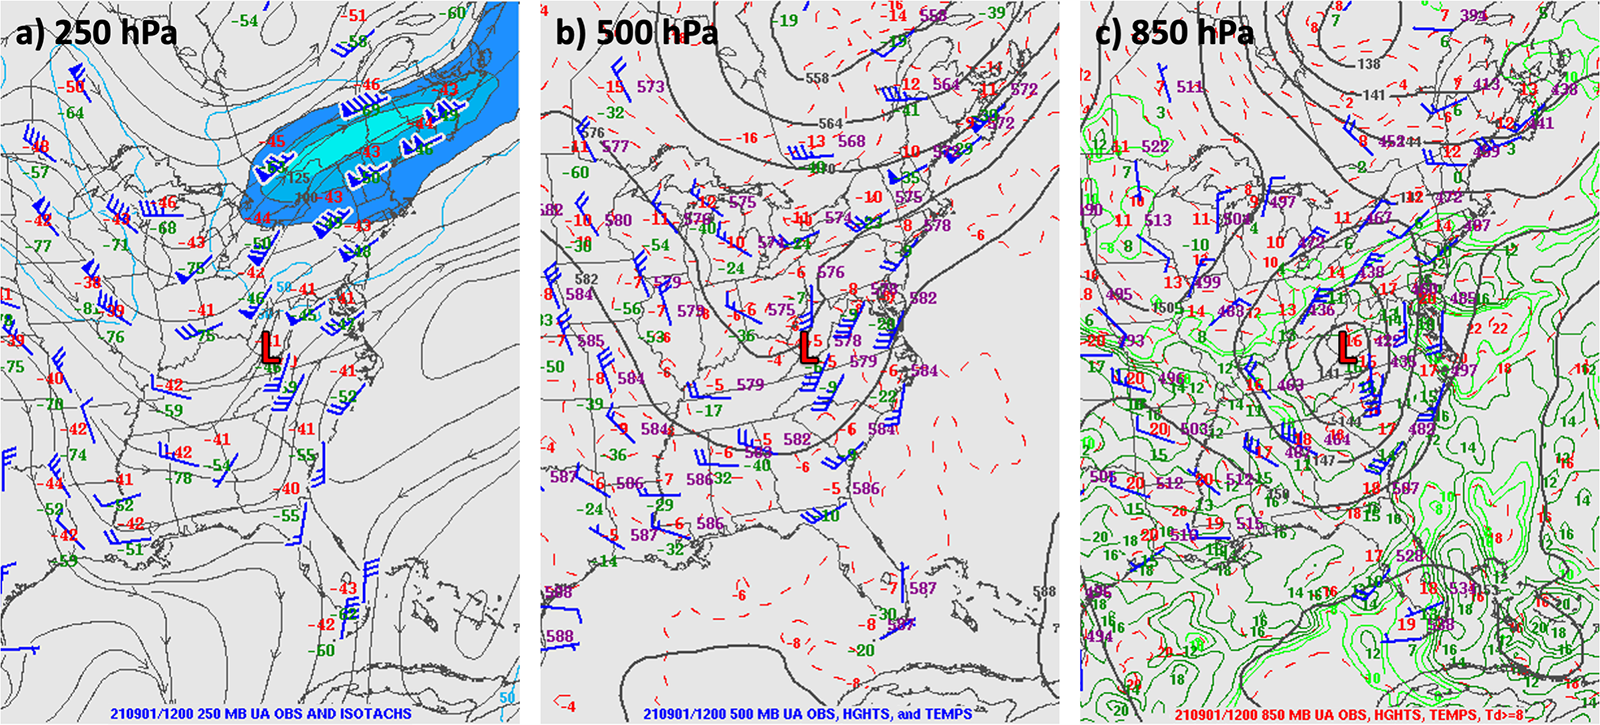
The upper-level charts (source: NCEP Storm Prediction Center) at the 250, 500, and 850 hPa pressure levels show the weather pattern present at 8:00 a.m. EDT September 1. The surface center of Post-Tropical Cyclone Ida is located in southern West Virginia and is marked with the red-filled black “L” on each upper-level chart. At the 250 hPa level, a trough is located in the Ohio Valley and Great Lakes region. Ida is located on the eastern flank of this trough. A 125-knot jet streak is located over the St. Lawrence Valley in Ontario, Quebec, and New Brunswick. A 500-hPa trough is located in the Ohio Valley just west of Ida and a shortwave ridge is located downstream from northwest Pennsylvania to southern New Jersey. At 850 hPa, a broad closed low associated with Ida covers much of the eastern third of the US. A strong southerly low-level jet and moist axis is located from the Carolinas northward to southeast Pennsylvania and New Jersey.
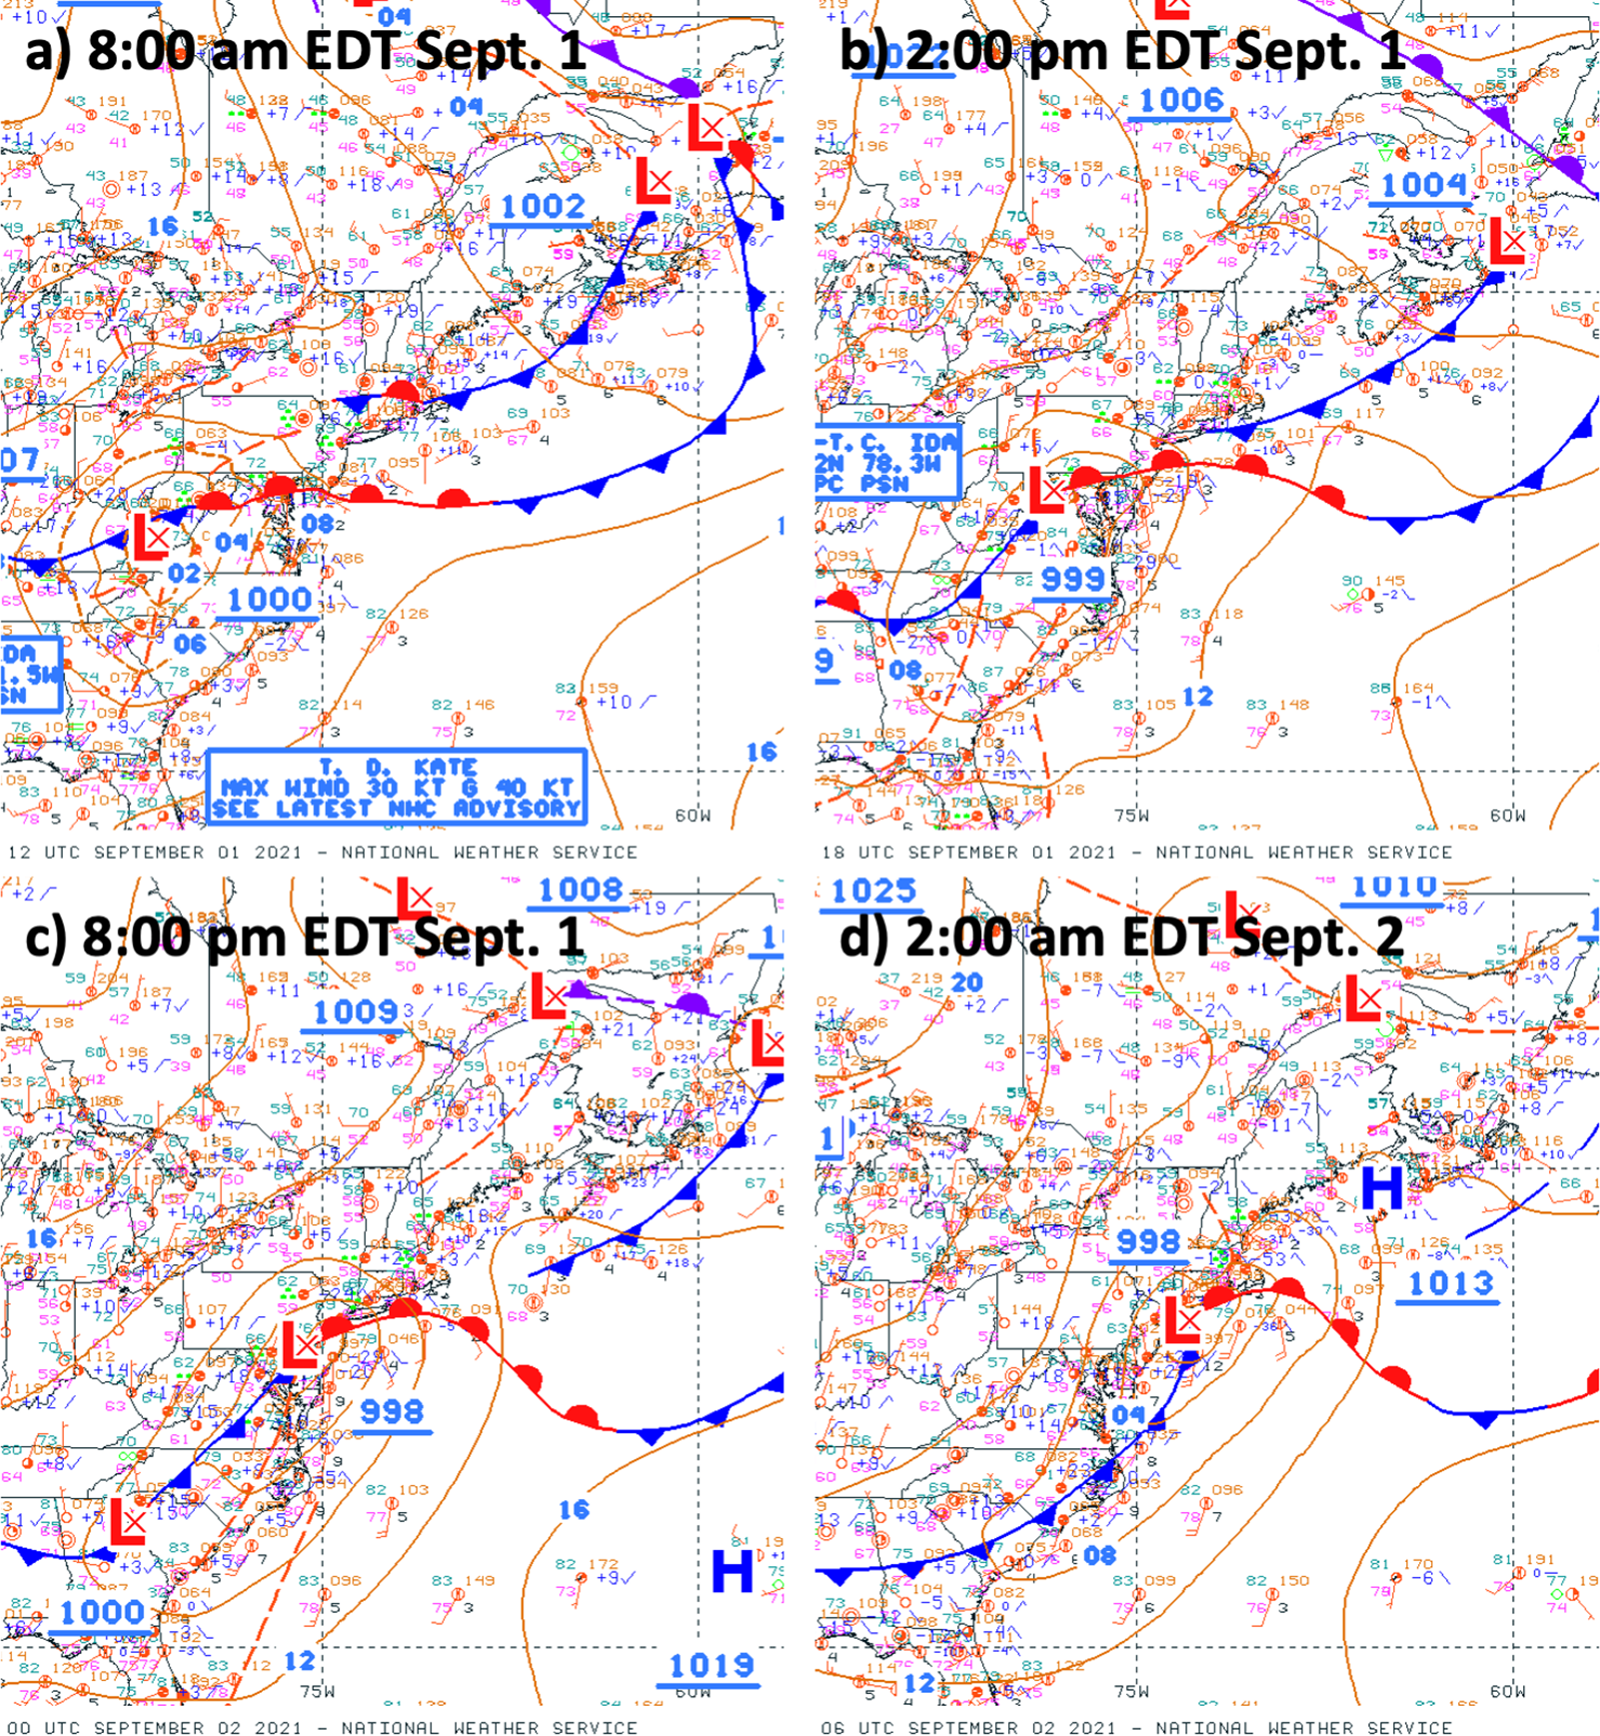
The unified surface analysis (source: NCEP Ocean Prediction Center) shows that Ida underwent extratropical transition and acquired warm and cold fronts by 8:00 a.m. EDT on September 1. The warm front extended northeast from the center of Ida through northern Virginia and southern New Jersey and offshore. Ida moved to southeast Pennsylvania by the evening of September 1. The warm front moved north during the same period, with surface southeasterlies developing over much of the Mid-Atlantic states in Ida’s warm sector. Surface dew points exceeded 70 degrees Fahrenheit in the region. In all, the upper-level and surface charts depict a weather pattern that brings together all of the key ingredients for excessive rainfall. Enhanced moisture and instability were located in the warm sector of Ida. Synoptic-scale lift in southern New England and the Mid-Atlantic states was associated with the right-entrance region of the upper-level jet streak and differential cyclonic vorticity advection ahead of the upper-level trough. Forcing for rising motion (lift) was also associated with warm air advection on the eastern flank of Ida, concentrated along the warm front that stretched northeast of Ida.
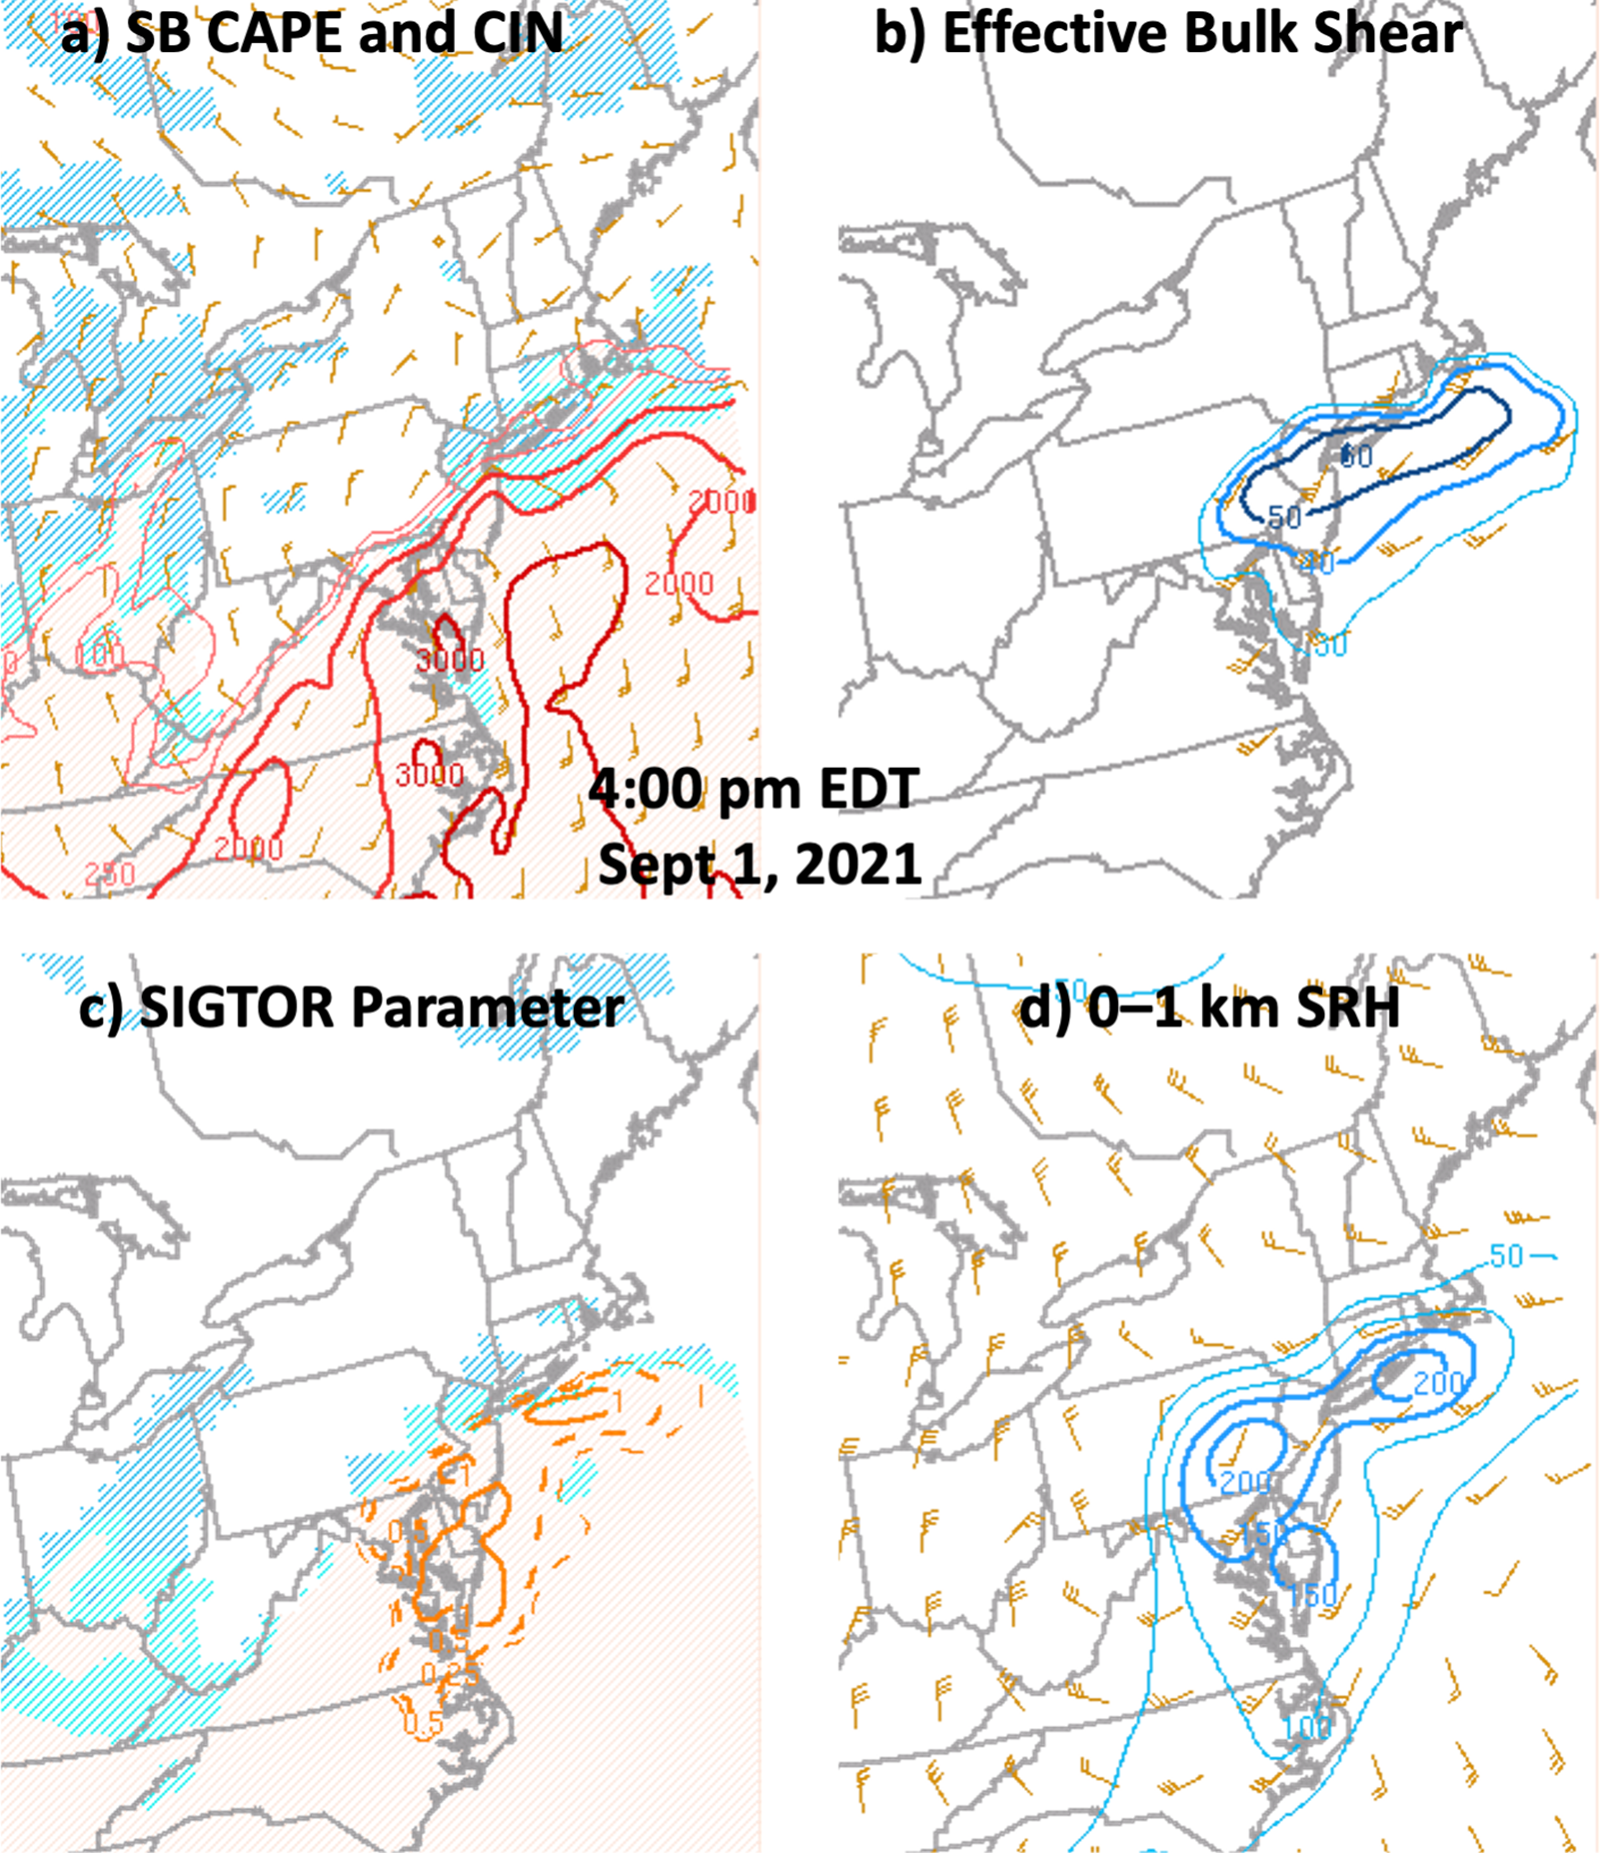
The SPC mesoscale analysis from 4:00pm EDT shows that in addition to a synoptic-scale weather pattern favorable for extreme rainfall, the environment was also favorable for the occurrence of severe thunderstorms and tornadoes in the warm sector of Ida. Plenty of instability was present as surface-based convective available potential energy (CAPE) over 3000 J/kg and minimal convective inhibition (CIN) extended through the Mid-Atlantic states, with the northern edge of the highest instability bounded by the surface warm front. On the northern flank of the highest instability in the warm sector, vertical wind shear in the 0-6 km layer exceeded 40 knots, which favors the development of organized thunderstorms with rotating updrafts. The storm-relative helicity (SRH) in the 0-1 km layer exceeded 150 m2 s-2 over much of Ida’s warm sector, but was especially concentrated in the region where surface winds backed to southeasterly in eastern Pennsylvania and western New Jersey. High values of SRH at low-levels indicate that the environment is favorable for thunderstorms to develop low-level rotation which may lead to tornadoes. In fact, the significant tornado (SIGTOR) parameter exceeded 1.0 (and even 1.875) from southern Maryland to New Jersey and extreme southeast Pennsylvania, indicating the potential for strong tornadoes in the region.
2. Radar analysis
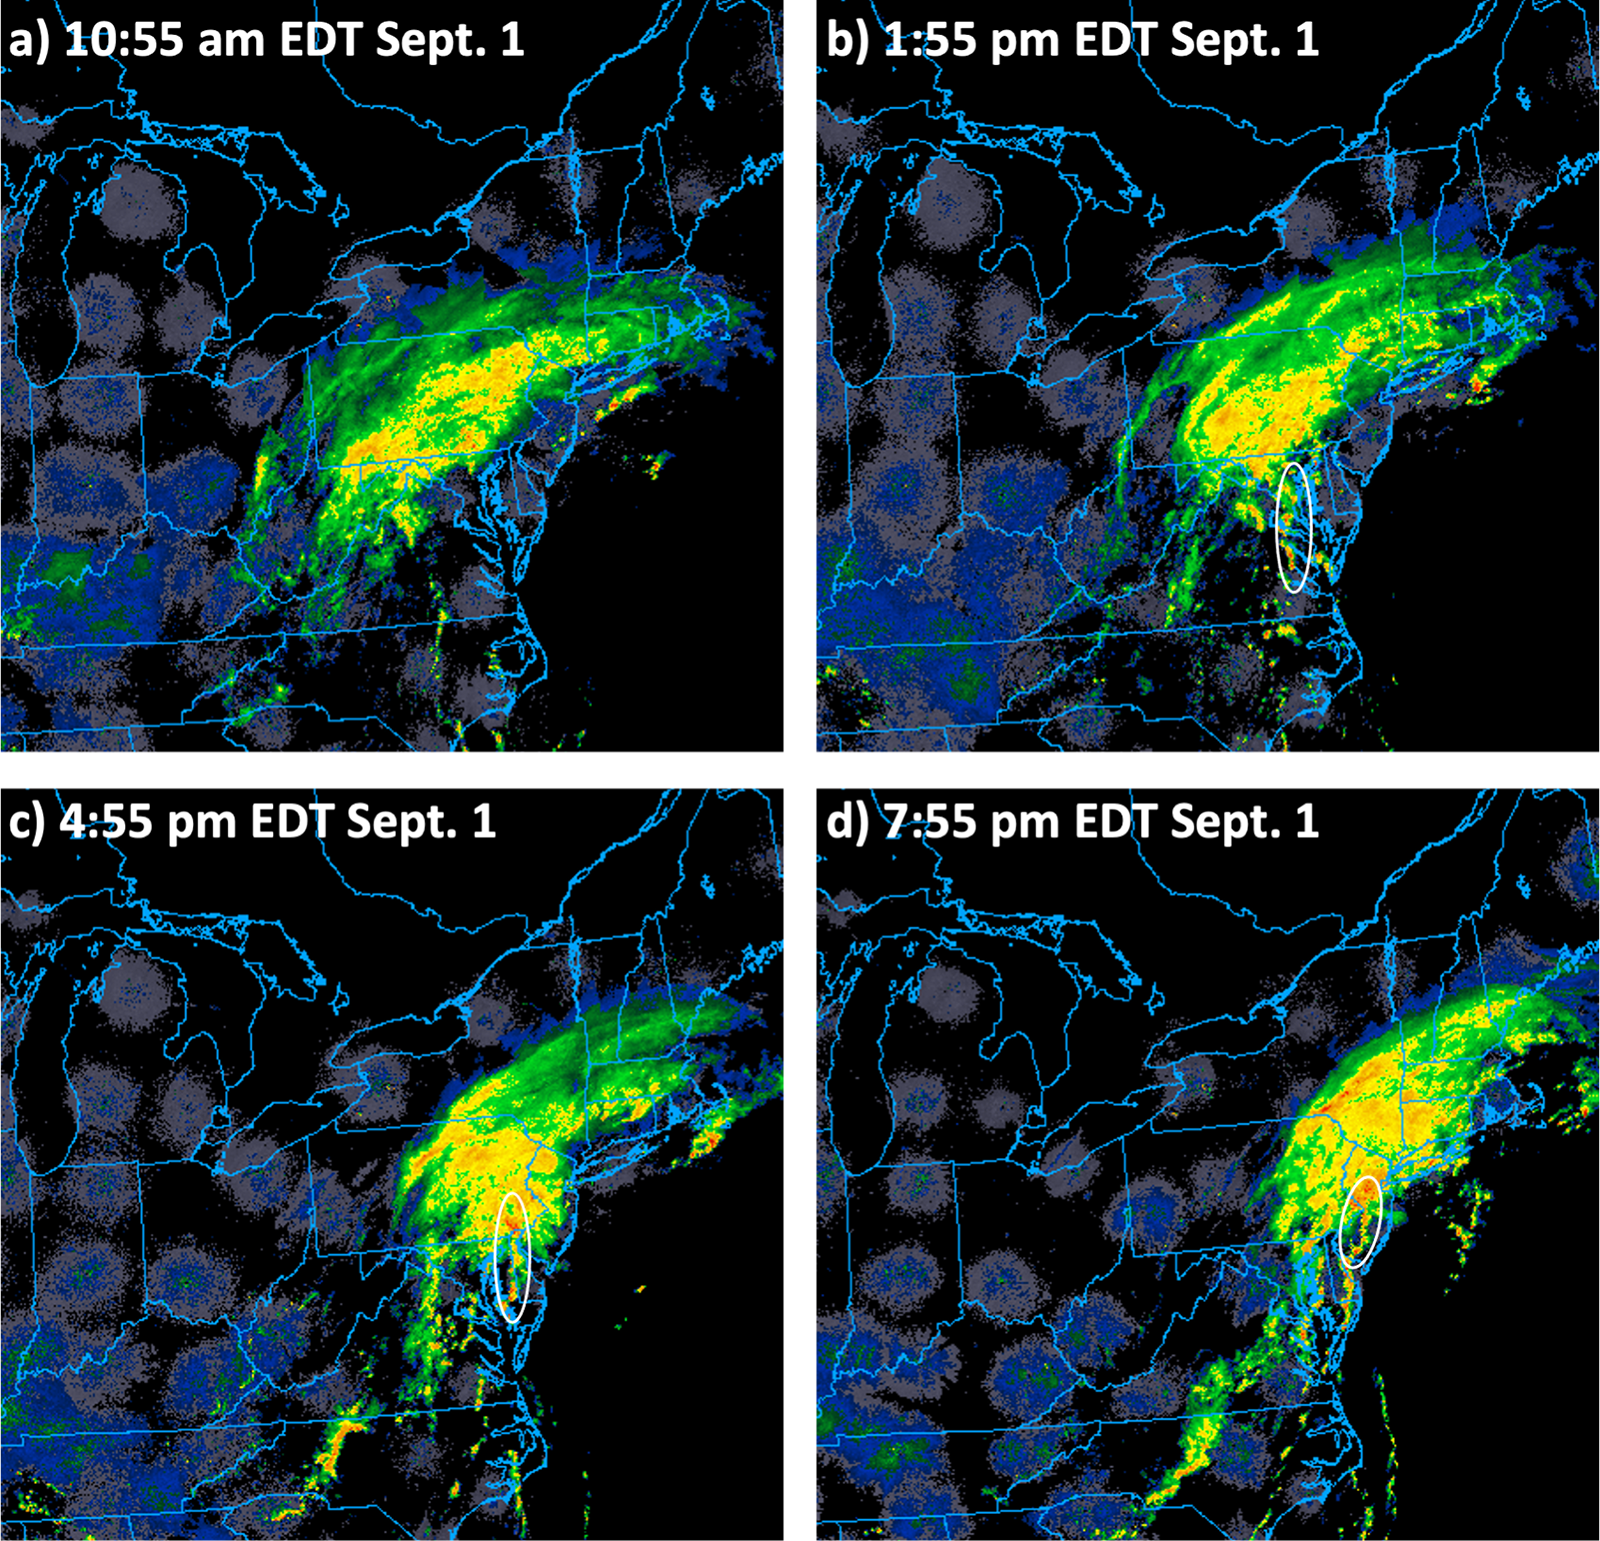
This sequence of imagery shows radar reflectivity for the Mid-Atlantic states and northeast U.S. from 10:55 am through 7:55 pm EDT on September 1 (courtesy of UCAR and College of DuPage). Throughout the day, a broad shield of stratiform precipitation was located north and northeast of Ida on the north side of the warm front and contributed to the exceptional rainfall amounts along and left of Ida’s track. By early afternoon, intense thunderstorms developed in the warm sector southeast of Ida’s center of low pressure. This cluster of warm sector thunderstorms, in eastern Virginia and western Maryland at 1:55 pm EDT, moved northeastward reaching central New Jersey by 7:55 pm EDT and produced numerous tornadoes as summarized by Table 1 appended at the bottom of this summary.
This is a loop of radar (left) reflectivity and (right) velocity from 2:15-2:59 p.m. EDT September 1 as the initial line of supercells east of Washington D.C. produced 4 tornadoes in Maryland (imagery courtesy of RadarScope Pro). The location of the Doppler radar is marked by the black dot south of Milford, Delaware. Numerous circulations are evident in the radial velocity imagery during the period, most notably just north of Arnold, Maryland, near 2:30 p.m. EDT.
This is a loop of radar (upper left) reflectivity and (upper right) velocity from 5:15-5:59 p.m. EDT September 1. The location of the Doppler radar is marked by the black dot in southern New Jersey. In addition to numerous short-lived circulations in northeast Pennsylvania and northern New Jersey, a key feature is the line of storms that approaches Philadelphia. Several circulations are apparent as the line approaches. At 5:45 p.m. a well-defined circulation is located just south of Woodstown (south of Philadelphia) with the supercell storm located at the southern end of the line of thunderstorms. Other circulations are located near New Garden and West Chester by 5:59 p.m. The most intense circulation tracked from west of Philadelphia at 5:15 p.m. through the west side of Warminster and to just south of Buckingham, Pennsylvania, by 5:59 p.m. This intense circulation shows a debris signature in the reflectivity (upper left) and correlation coefficient product (lower left) near Warminster (look for a small circular blue region that appears near 5:45 p.m.), indicating that a tornado was producing damage in this region. This particular tornado resulted in 1 fatality.
This is a loop of radar (upper left) reflectivity and (upper right) velocity from 6:35-7:20 p.m. EDT September 1. The location of the Doppler radar is marked by the black dot in southern New Jersey. Several circulations are apparent west of Philadelphia. Perhaps the most robust, long-lived circulation tracks from just east of Philadelphia at 6:35 p.m. to near Trenton by 7:20 p.m. A hook echo signature is clear on the reflectivity and is accompanied by a rotation signature in the velocity field. Additionally, the correlation coefficient (lower left) field shows evidence of a debris signature just east of Philadelphia and then again as the storm passes from Burlington to Florence, New Jersey.
3. WoFS forecast of tornado threat
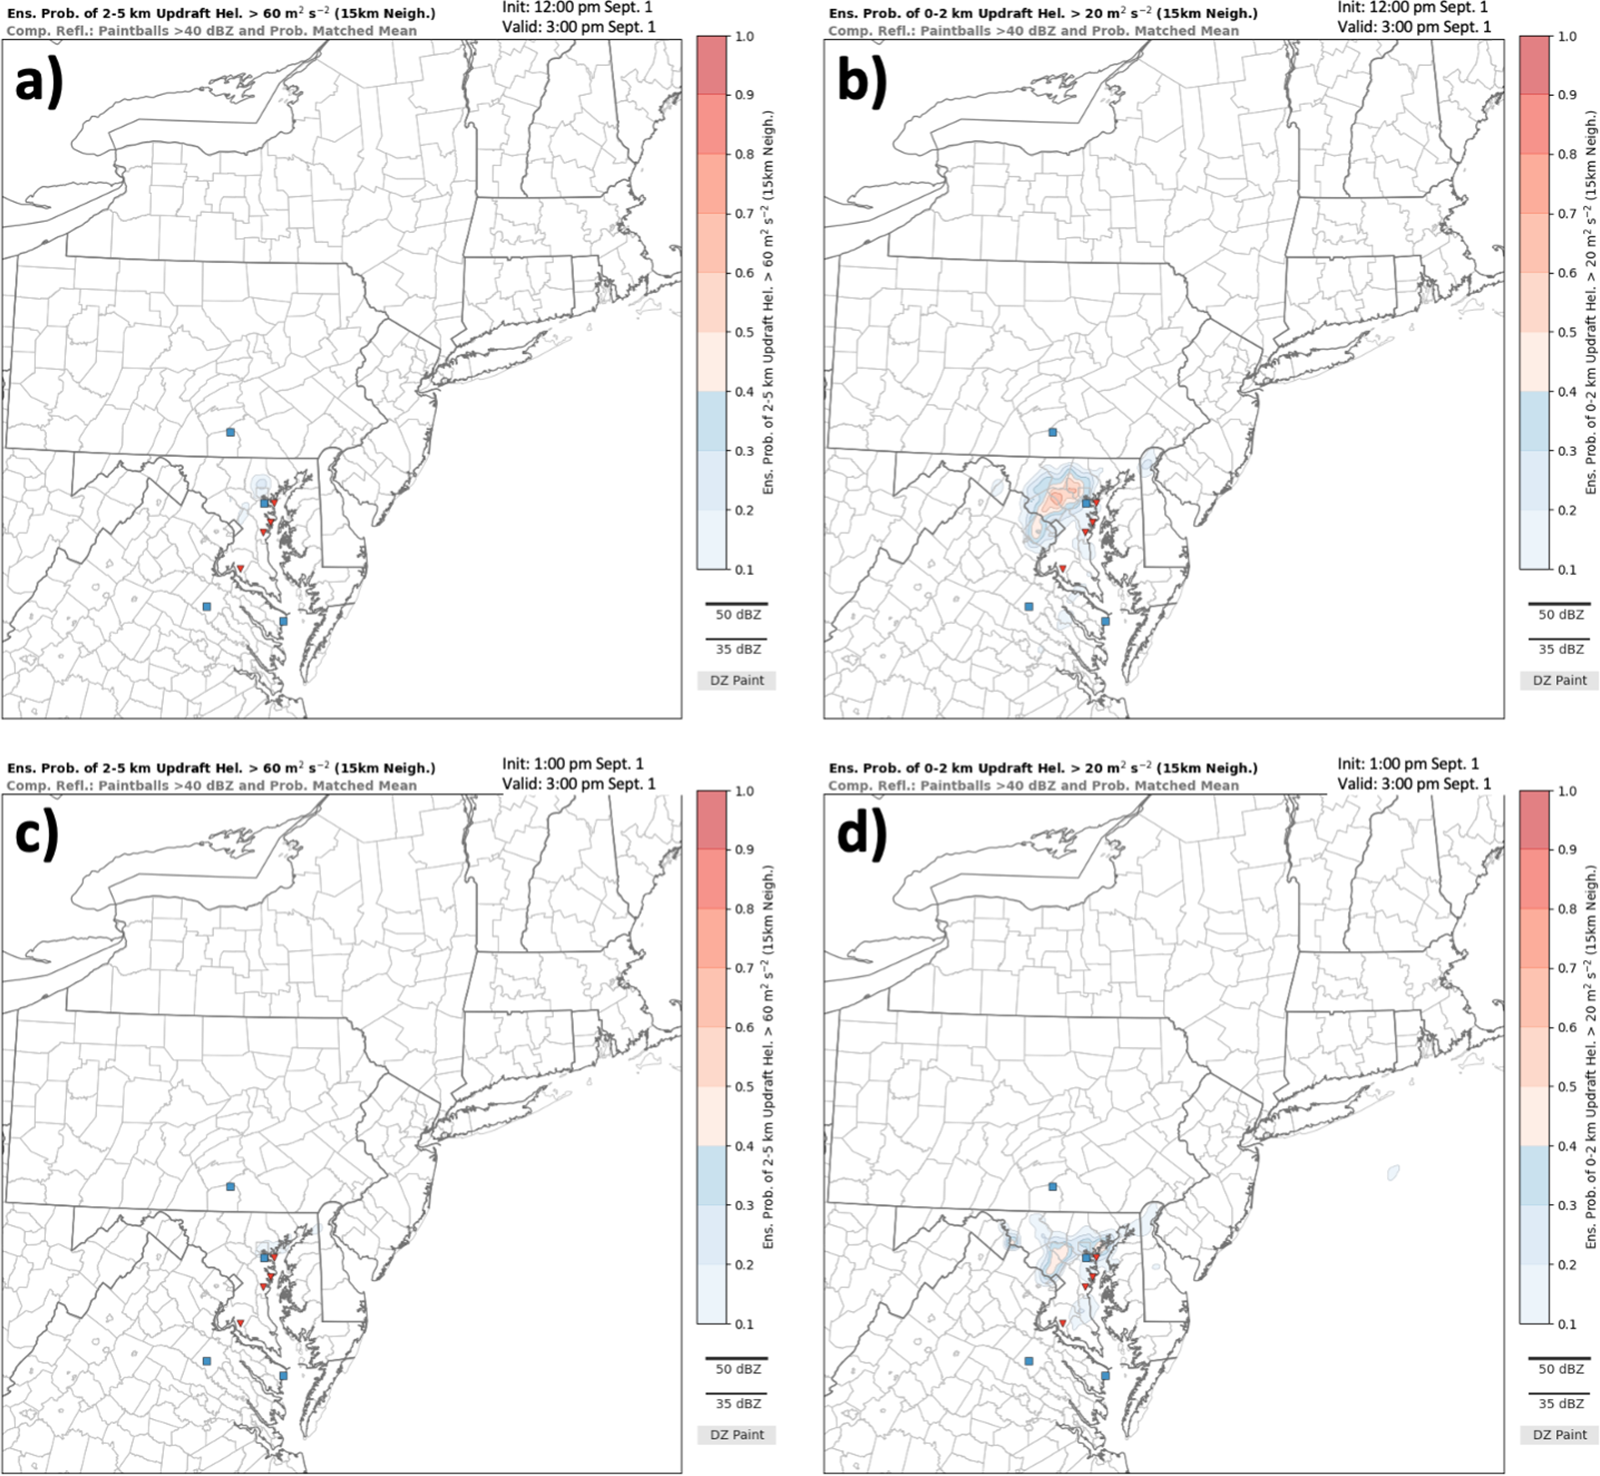
These are WoFS forecasts valid (top) 12:00 p.m. through 3:00 p.m. September 1 and (bottom) 1:00 pm through 3:00 p.m. September 1. In the left column, the color shading shows the probability of updraft helicity in the 2-5 km layer above the ground exceeding 60 m2 s-2. In the right column, the color shading shows the probability of updraft helicity in the 0-2 km layer above the ground exceeding 20 m2 s-2. Updraft helicity is a parameter we calculate that indicates storm rotation. The observed tornado (red triangles) and severe thunderstorm wind (blue squares) reports valid through 3:00 p.m. EDT are overlaid on each panel. The WoFS forecast period covers the initial batch of tornadoes that occurred in Maryland in the early afternoon. As has been noted in WoFS forecasts for tropical systems, the signature for rotating updrafts is better represented by the updraft helicity in the 0-2 km layer, as rotating updrafts associated with supercells with tropical systems tend to be shallower and best defined closer to the ground compared to typical supercell storms. While WoFS emphasized the line of storms farther west in Maryland rather than the leading line near the eastern shore during this period, the guidance still provides useful information alerting forecasters to the potential for rotating thunderstorms in the warm sector of Ida.
This is a loop of a WoFS forecast valid from 3:00 p.m. through 9:00 p.m. September 1. The colored shading (easiest to see as an orange streak developing along the PA/NJ border) represents the probability of updraft helicity in the 0-2 km layer above the ground exceeding 20 m2 s-2. The black contours represent where the storms are, on average among the 18 members of the WoFS ensemble. This WoFS forecast shows high probability (> 80%) that thunderstorms with strong rotating winds will move northeast along the Interstate-95 corridor and regions from Maryland to Pennsylvania and New Jersey through 9:00 p.m. EDT on September 1. The observed storm reports (red triangles) show that the WoFS forecast provided excellent guidance in highlighting the key swath where tornadoes would occur in the 6:00 p.m. to 9:00 p.m. EDT time frame.
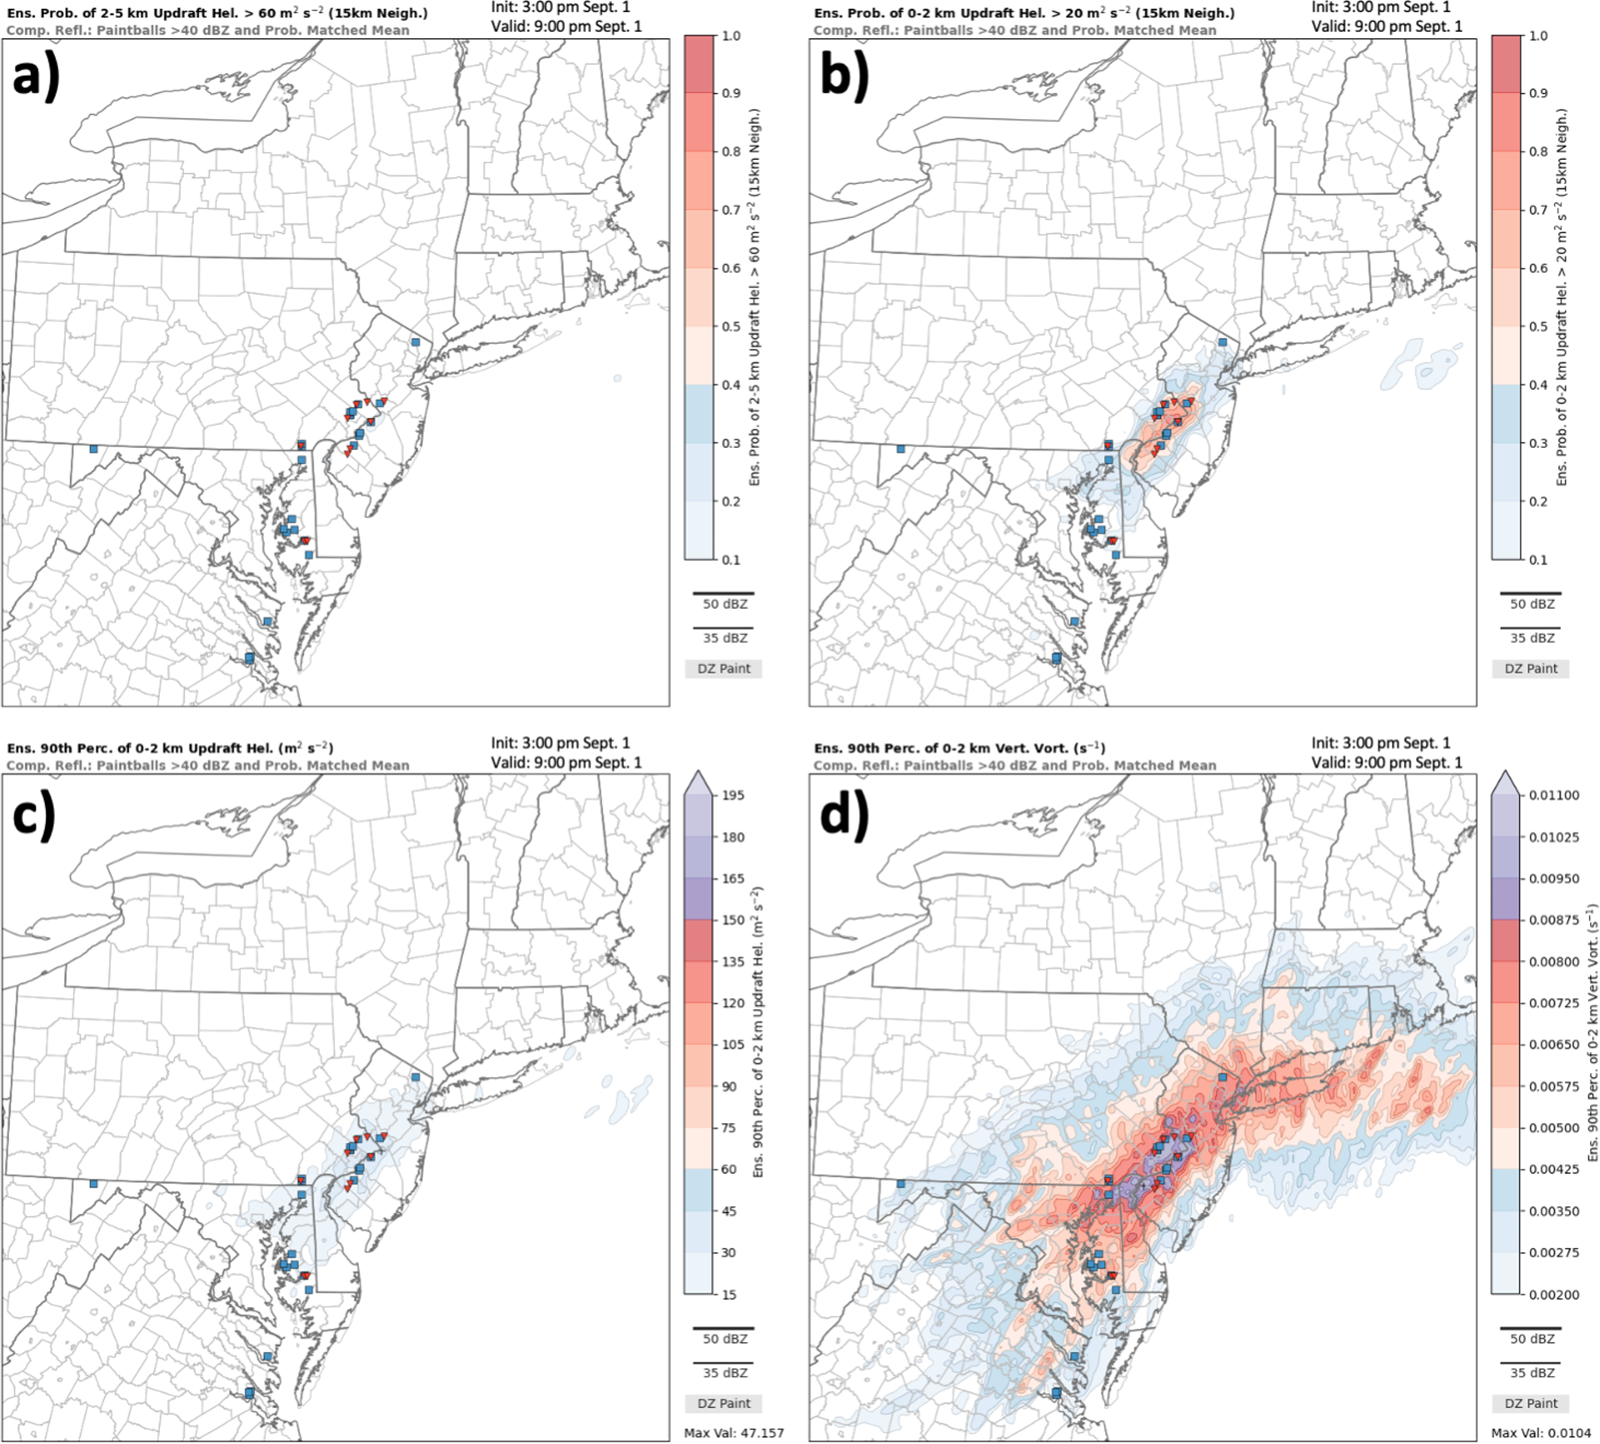
This image shows a comparison of (upper left) the probability of updraft helicity in the 2-5 km layer above the ground exceeding 60 m2 s-2, (upper right) the probability of updraft helicity in the 0-2 km layer above the ground exceeding 20 m2 s-2, (lower left) ensemble 90th percentile of updraft helicity in the 0-2 km layer, and (lower right) ensemble 90th percentile of vertical vorticity in the 0-2 km layer valid for 3:00 p.m. to 9:00 p.m. EDT September 1. The observed tornado (red triangles) and severe thunderstorm wind (blue squares) reports valid through 9:00 p.m. EDT are overlaid on each panel. The ensemble 90th percentile value provides a measure of potential severity (higher values means stronger rotation). The WoFS forecast highlights the key corridor in Pennsylvania and New Jersey where tornadoes occurred. While there is not a signal for rotating storms for updraft helicity in the 2-5 km layer, there is a robust signature at the lower 0-2 km layer which is consistent with WoFS forecasts of tornadoes for other tropical systems such as Harvey (2017) and Laura (2020). In addition to the high probability of rotating storms, the WoFS forecast indicates a high potential severity in Pennsylvania and New Jersey based on the 90th percentile values of updraft helicity and vertical vorticity in the 0-2 km layer. Analysis of previous tropical systems has shown the 0-2 km vertical vorticity to be a good measure for anticipating the potential severity of tropical cyclone tornado events and that is certainly the case here with Ida.
4. WoFS forecast of excessive rainfall
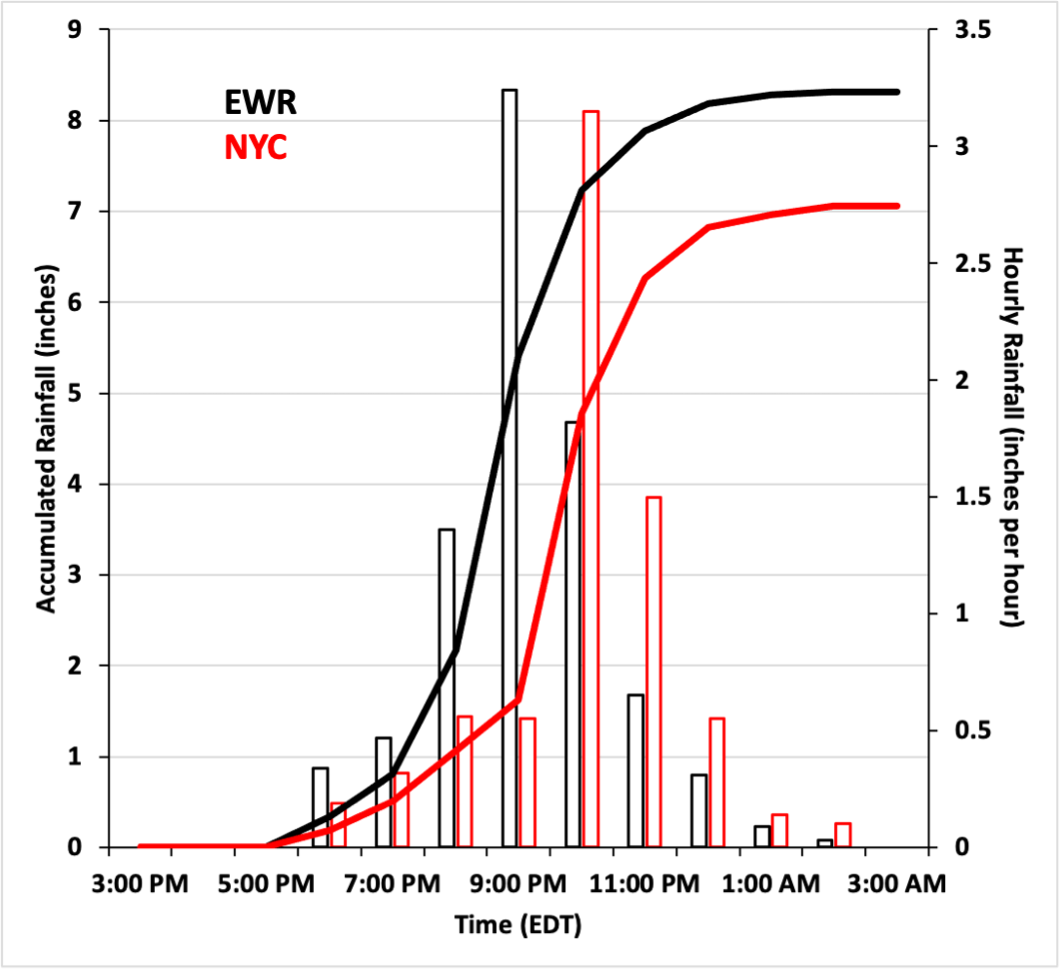
This time series plot shows the observed total accumulated rainfall (lines and use left y-axis) in inches and hourly rainfall rates (bars and use right y-axis) in inches per hour for Newark, New Jersey (EWR in black), and Central Park, New York (NYC in red), beginning in the mid-afternoon on September 1 and ending in the very early morning hours on September 2. Each time on the x-axis marks the accumulated rainfall from 2:00 pm EDT until that time and the hourly rainfall for the hour ending at that time. EWR recorded over 8 inches and NYC over 7 inches of rainfall after 2:00 pm EDT. The heaviest rainfall period with greater than 1 inch per hour rain rates occurred at EWR from 7:00-10:00 p.m. and NYC from 9:00-11:00 p.m. The peak hourly rain rate at EWR was 3.24 inches from 8:00-9:00 p.m. NYC set an hourly rainfall rate record for that site of 3.15 inches from 9:00-10:00 p.m. In all, EWR had its wettest day on record and NYC had its 5th wettest day on record.
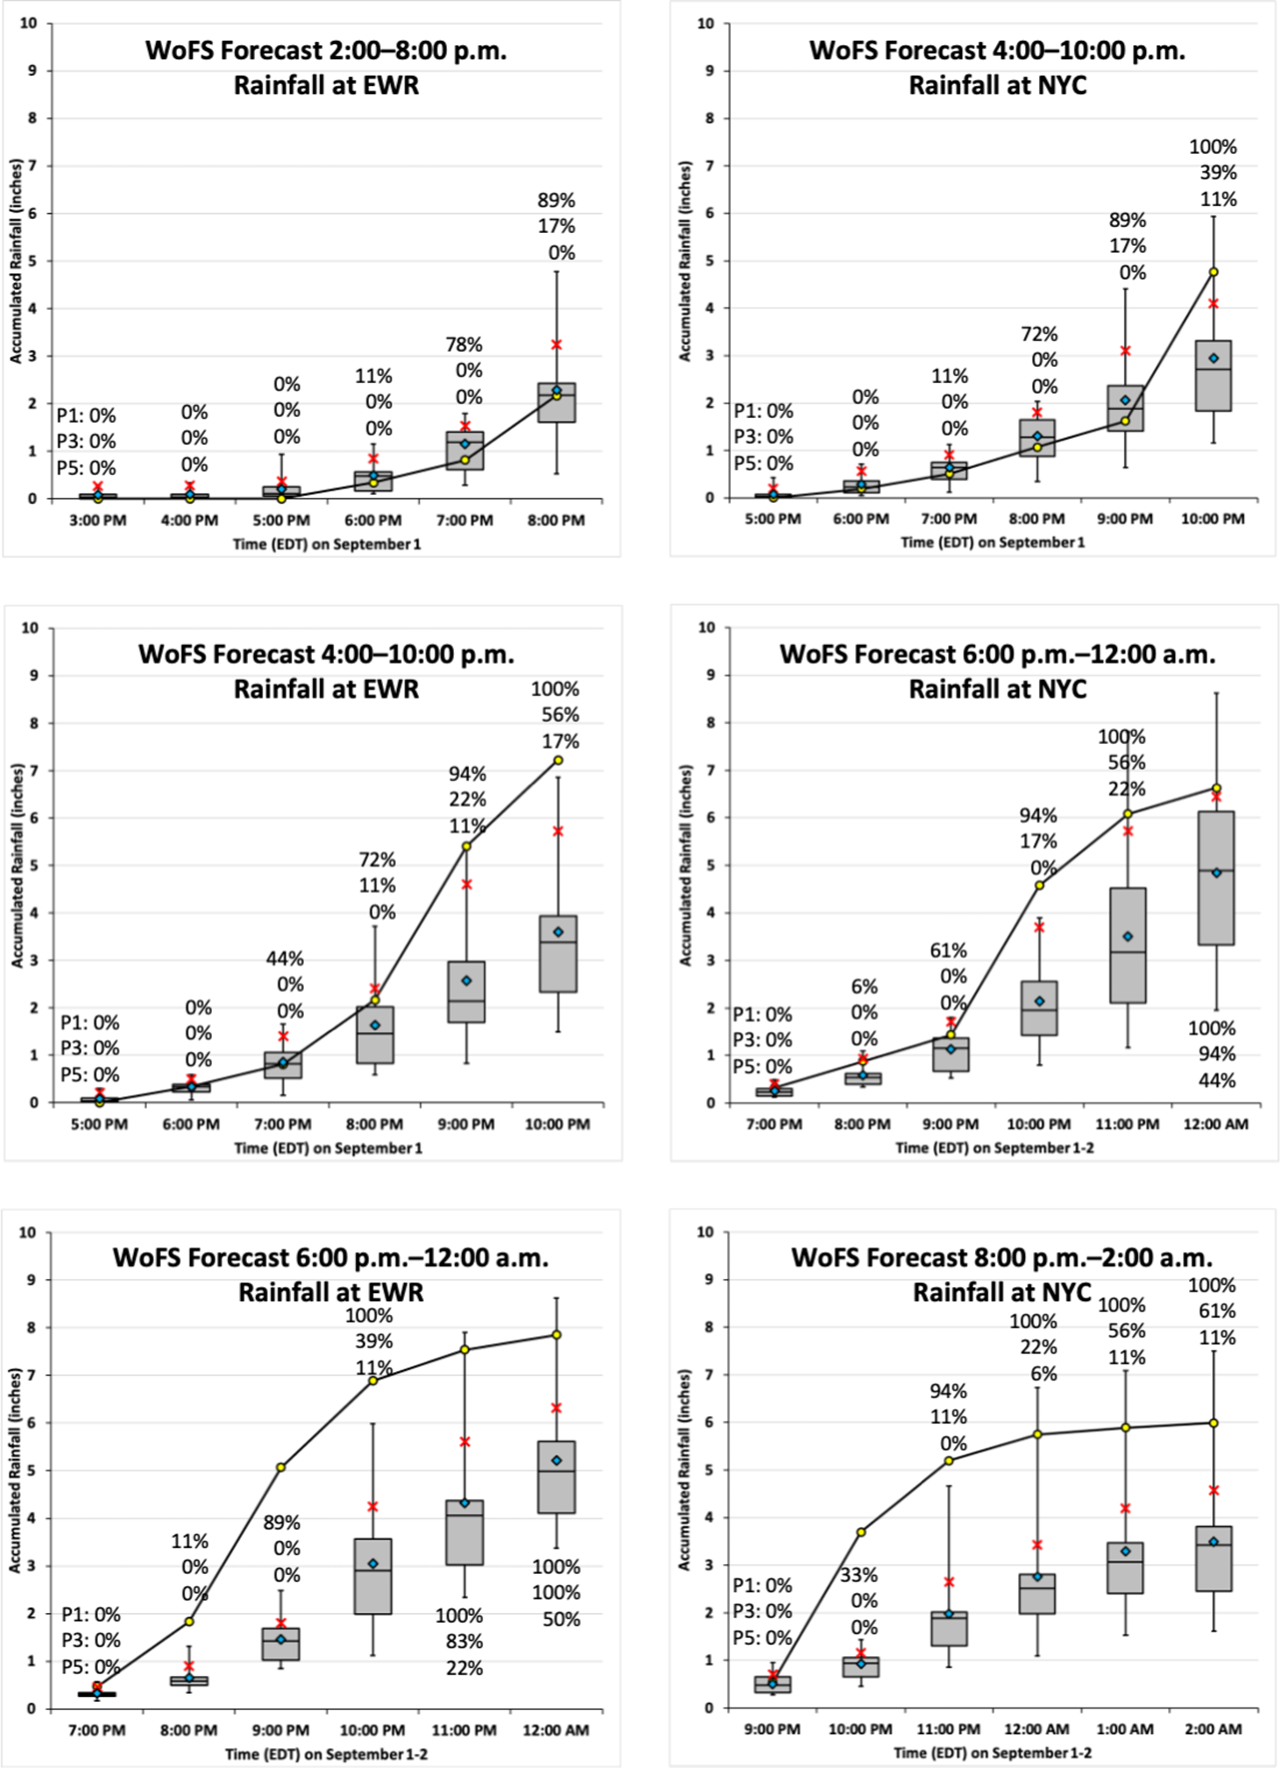
This multipanel figure shows the time series of observed accumulated rainfall (black line with yellow-filled black circles) in 6-hour periods at EWR (left column) and NYC (right column) that correspond to the different WoFS forecast periods. The box and whisker plots show the WoFS ensemble forecast accumulated rainfall. The gray box is bounded by the upper- and lower-quartile and the black line in the middle of the gray box marks the median value. The ensemble mean accumulated rainfall is shown by the blue-filled black diamond and the 90th percentile value by the red ‘x’. The whiskers mark the ensemble maximum and minimum accumulated rainfall. At each time, the ensemble probability of exceedance of 1, 3, and 5 inches of accumulated rain (denoted as P1, P3, and P5, respectively, and using a 27 km neighborhood) is indicated.
The WoFS forecasts for rainfall at EWR followed observations quite well for the forecast initialized at 2:00 p.m. About 90% of the ensemble members produced at least 1 inch of rain in the 6 hour period, and the ensemble mean value of 2.28 inches agreed well with the observed 2.17 inches of rain for the 6 hour period. The WoFS forecast initialized at 4:00 p.m. covered the period of most extreme rain rates at 8:00-9:00 p.m. While WoFS generally under-forecast the rain rates after 8:00 pm, the probability of exceeding 3 inches of rainfall in the 6 hour period reached 56% indicating that heavy rainfall was likely. The 90th percentile value of almost 6 inches indicated the potential high severity of this event, despite the lower ensemble mean values. The WoFS forecast initialized at 6:00 p.m. had difficulty keeping up with the extreme rain rates in the 8:00-10:00 p.m. period, but nonetheless, the 6 hour forecast indicated a 100% probability of exceeding 3 inches and 50% probability of exceeding 5 inches of rain during the period, making it clear that extreme rainfall was to be expected. The 90th percentile value exceeded 6 inches of rain, pointing to the high potential severity and impacts in the evening hours at EWR.
The WoFS forecasts for rainfall at NYC also followed observations quite well in the earlier forecasts at 4:00-10:00 p.m. However, later forecasts initialized at 6:00 p.m. and in particular at 8:00 p.m. had difficulty in keeping up with the extreme rain rates. In other words, the rainfall accumulation occurred in WoFS, but was too slow and not quite heavy enough. Nonetheless, the forecast initialized at 6:00 p.m. indicated a 94% probability of exceeding 3 inches of rain and a 44% probability of exceeding 5 inches of rainfall, clearly indicating that extreme rainfall was to be expected at NYC in the late evening hours. The 90th percentile value exceeded 6 inches of rain in that forecast, highlighting the high potential severity of this event. The WoFS forecast initialized at 8:00 p.m. had reduced probabilities of rainfall exceeding 3 and 5 inches, and had much more difficulty keeping up with the extreme rain rates.
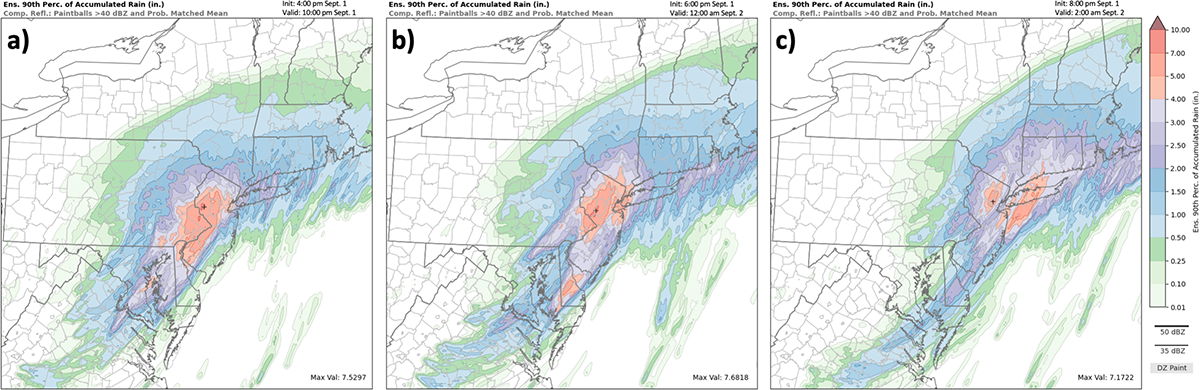
This multipanel image shows the WoFS forecast ensemble 90th percentile of 6-hour total accumulated rainfall (shaded in inches) for the forecast valid at (left) 4:00-10:00 p.m. September 1, (middle) 6:00 p.m. September 1 through 12:00 a.m. September 2, and (right) 8:00 p.m. September 1 through 2:00 a.m. September 2. The WoFS forecasts show a swath of > 4 inches of rainfall that begins in Pennsylvania and New Jersey and develops northeastward in the evening hours on September 1 and extends northeastward into extreme southern New York and Connecticut during the late evening and overnight hours. The grid point maximum rainfall amount for each of these 6 hour periods exceeds 7 inches, and the guidance is consistent with the observed swath of > 6 inches of rainfall that extends from southeast Pennsylvania to Connecticut on 1-2 September (see the first graphic in this article). For the forecast initialized at 8:00 p.m., there are reduced rainfall amounts near NYC that are sandwiched between higher amounts to the east and west. This signature is consistent with the time series analysis. The question is: why did WoFS ensemble probability of extreme rainfall decrease in the 8:00 p.m. forecast compared to earlier forecasts?
The shading in this loop shows composite reflectivity from WoFS member #3 which shows a representative evolution of the forecasted rainfall from 8:00-11:00 p.m. EDT of September 1. In observations, the thunderstorms in central New Jersey at the start of the loop moved northeast through southern New York and New England and were responsible for the extreme rains at NYC. In the WoFS forecast, however, thunderstorms form by 9:00 p.m. along the New Jersey shore. The WoFS forecast incorrectly latches onto these new thunderstorms, which in reality did not occur, while weakening the storms that were approaching from central New Jersey. As a result, a rainfall “gap” occurs in NYC in the WoFS forecast and explains the reduced ensemble probability of extreme rain compared to earlier WoFS forecasts.
Overall, WoFS performance for this event was a resounding success. Low level updraft helicity and vertical vorticity forecasts were particularly good at defining the region in Pennsylvania and New Jersey where the majority of tornadoes would be observed, and this was done with a few hours lead time. The evolution of rainfall in WoFS over eastern Pennsylvania through New Jersey and New York City was indicative of very heavy rainfall rates and the gradual accumulation of 3 to 5 inches of rain in an urban environment. The rainfall forecasts, especially for New York City, became less consistent during the height of the event, but the preponderance of the evidence from WoFS, alongside of the information forecasters had from observations and media and spotter reports, certainly pointed to a dangerous event that was likely to continue unfolding through the late evening.
5. Tables
These tables summarize the Storm Prediction Center tornado reports and NCEP Stage-IV and METAR-derived rainfall at select locations on September 1-2, 2021.
| Time (EDT) | Location | County | State | Details |
|---|---|---|---|---|
| 1350 | 3 W Wicomico | Charles | MD | LAW ENFORCEMENT REPORTED TORNADO TOUCHDOWN NEAR ALLENS FRESH MOVING TOWARDS DENTSVILLE. NO DAMAGE REPORTED YET TO THE COUNTY. (LWX) |
| 1400 | 3 W Galesville | Anne Arundel | MD | EF-2 WITH ESTIMATED PEAK WINDS OF 125 MPH PATH LENGTH: 11.25 MILES MAX WIDTH: 200 YARDS (LWX) |
| 1416 | Annapolis | Anne Arundel | MD | COUNTY EMERGENCY MANAGEMENT REPORTS TREES AND WIRES DOWN ... AND DAMAGE TO BUILDINGS THROUGHOUT THE RIVA ... WOODLAND BEACH ... AND ANNAPOLIS AREA. (LWX) |
| 1448 | 1 SSE Ft. Howard | ANZ531 | MD | EF-0 WITH ESTIMATED PEAK WINDS OF 85 MPH. PATH LENGTH: 6.7 MILES MAX WIDTH: 75 YARDS (LWX) |
| 1615 | 1 SSE Oxford | Chester | PA | AN EMBEDDED SUPERCELL IN A QUASI-LINEAR FEATURE PRODUCED A TORNADO NEAR OXFORD ... PA. A PATH OF DAMAGE BEGAN IN CROP LAND NEAR THE INTERSECTION OF 5TH STREET AND WATERW (PHI) |
| 1656 | 2 NW Hurlock | Dorchester | MD | TORNADO ON THE GROUND NEAR NEW MARKET. (AKQ) |
| 1711 | 1 NNE Hurlock | Dorchester | MD | VIDEO OF A TORNADO CROSSING GRAVEL BRANCH RD. (AKQ) |
| 1735 | 2 NNE Whitemarsh | Montgomery | PA | *** 1 FATAL ... 2 INJ *** A SEMI-DISCRETE SUPERCELL THUNDERSTORM BEGAN TO EXHIBIT ROTATION OVER DELAWARE COUNTY ... PA AROUND 5:15 PM ON SEPTEMBER 1. THE ROTATION CONTINU (PHI) |
| 1759 | 1 WNW Warwick | Bucks | PA | THE STORM WHICH PRODUCED A STRONG TORNADO IN MONTGOMERY COUNTY ... PA ... CYCLED AND PRODUCED ANOTHER TORNADO IN BUCKS COUNTY ... PA. DAMAGE BEGAN NEAR IN THE AREA OF NESH (PHI) |
| 1810 | 1 SE Harrisonville | Gloucester | NJ | *** 2 INJ *** CORRECTS PREVIOUS TORNADO REPORT FROM 1 SE HARRISONVILLE. THE TORNADO TOUCHED DOWN NEAR HARRISONVILLE ... NJ DOING MOSTLY DAMAGE TO TREES AND LIMBS BEFORE (PHI) |
| 1821 | 1 ENE Mullica Hill | Gloucester | NJ | SIGNIFICANT DAMAGE IN THE MULLICA HILL AREA INCLUDING SEVERAL HOMES DAMAGED AND TREES DOWN ON CEDAR ROAD. TIME ESTIMATED FROM RADAR. (PHI) |
| 1830 | Upper Makefield | Bucks | PA | A TORNADO EMBEDDED WITHIN A SQUALL LINE DEVELOPED SEVERAL MILES SOUTHEAST OF THE STORM WHICH PRODUCED A TORNADO IN BUCKINGHAM TOWNSHIP. TORNADIC DAMAGE WAS FIRST OBSERV (PHI) |
| 1859 | 1 NE Cooperstown | Burlington | NJ | AFTER CYCLING FROM AN EARLIER TORNADO NEAR MULLICA HILL ... NJ ... A SUPERCELL THUNDERSTORM PRODUCED AN ADDITIONAL TORNADO IN BURLINGTON TOWNSHIP ... NJ NEAR THE TOWNSHIP (PHI) |
| 1932 | 2 W West Windsor | Mercer | NJ | A TORNADO TOUCHED DOWN ALONG EMMONS DRIVE ALONG ROUTE 1 IN PRINCETON ... NJ AS A REMNANT SUPERCELL MOVED NORTHWARD AFTER PRODUCING THE MULLICA HILL AND BURLINGTON ... NJ (PHI) |
| 0130 | Dennis | Barnstable | MA | EF-0 TORNADO WITH MAX WINDS NEAR 75 MPH. DAMAGE WAS OBSERVED IN A SMALL AREA NEAR THE INTERSECTION OF EAST BAY VIEW RD AND WAMPANOAG TRAIL. ONE HOME SUSTAINED DAMAGE WH (BOX) |
| Location | Rainfall (inches) | Notes |
|---|---|---|
| New Bedford, MA | 9.50 | |
| Staten Island, NY | 8.92 | |
| Newark, NG | 8.44 | Wettest day on record |
| Central Park, NY | 7.19 | 5th wettest day on record |
| Harrisburg, PA | 6.64 | 3rd wettest day on record |
| Trenton, NJ | 5.60 | 6th wettest day on record |
| Hartford, CT | 4.73 | |
| Baltimore-Washington, MD (BWI) | 4.13 | |
| Pittsburgh, PA | 3.95 |
| Rainfall threshold (inches) | EWR | NYC |
|---|---|---|
| 1 inch | 7:05 p.m. | 7:43 p.m. |
| 3 inches | 8:15 p.m. | 9:22 p.m. |
| 5 inches | 8:45 p.m. | 10:26 p.m. |
| Storm Total | 8.41 inches | 7.13 inches |
Storm summary of wind and rainfall observations from the Weather Prediction Center