
Warn-on-Forecast Case Studies
Large Hail Strikes Three Cities, April 28, 2021
During the evening of April 28, 2021, supercells with destructive hail struck three metropolitan areas in the southern Plains. The southernmost developed near Del Rio, Texas and moved into the San Antonio metro area. This supercell produced a swath of significant hail between the two cities, including a Texas state record 6.4-inch diameter stone near Hondo. The second supercell developed west of the Dallas-Fort Worth metroplex and moved through the western and northern sides of Fort Worth, producing 3-inch hail. The final supercell developed in central Oklahoma and passed through Norman, with widespread reports of wind-driven 2-3 inch hail which caused extensive damage. These storms all occurred within the WoFS real-time domain.
This case provides the opportunity to study the WoFS signals for significant severe hail that occurred simultaneously in different storm-scale environments.
Meteorological Setup
Storm Prediction Center (SPC) Day 1 Categorical Outlook [+]
Storm Prediction Center (SPC) Day 1 Hail Outlook [+]
The morning issuance of the Storm Prediction Center (SPC) Day 1 Convective Outlook highlighted an Enhanced Risk of severe weather from the Red River to the Rio Grande, including parts of the Texas Hill Country. Notably within this outlook, the hatched area for significant hail (2+ inches in diameter) did include Hondo, Texas, where the record hailstone fell. Hatching was not forecast over San Antonio, and the record-setting storm did, indeed, weaken considerably upon entering the city. Hatching also, however, did not extend into hard-hit Fort Worth and Norman. The meteorological discussion within the Day 1 Convective Outlook stated that confidence in specific storm locations was low, but that storms were expected to develop and become supercellular with a risk of very large hail.
The setup was synoptically driven by a strong upper-level closed low centered over the Sonoran Desert (northern Mexico and the Southwest United States), anchoring a strong zone of southwesterly winds aloft over the Southern Plains.
The surface boundaries were not easily diagnosed, as is often the case in mid to late spring over the Southern Plains, where moderately strong cold fronts are counteracted by strong surface heating and surges of both dry air from the west and very moist air from the Gulf. Below is one subjective analysis made for 2300 UTC, using temperature and instability fields from WoFS, as well as consulting surface observations from other times that day (not shown).
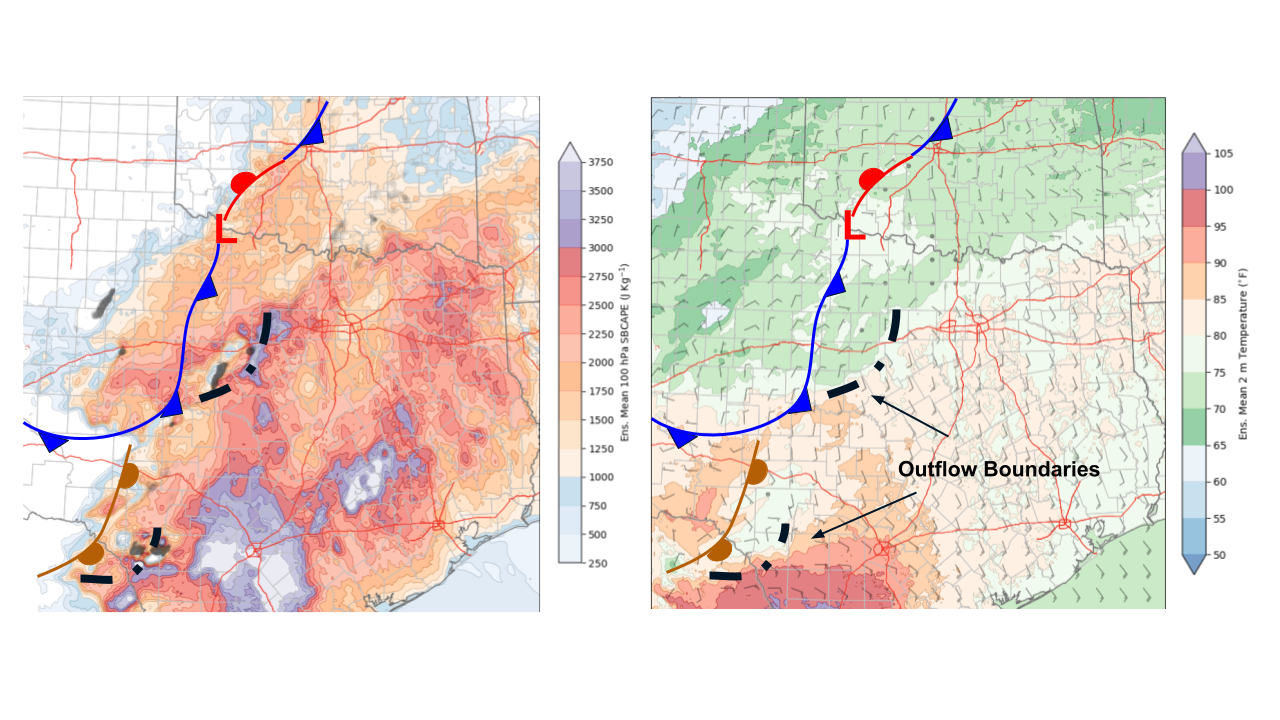
Left: Instability / CAPE; Right: Surface Temperature [+]
A cold front was fairly well defined from Kansas and Oklahoma through southwest Texas, supported by the strong upper level trough. A narrow wedge of dry air produced a dryline butting up against the mountains west of Del Rio. And by 2300 UTC, a few ongoing severe storms had begun to produce convective outflows near Del Rio and in north-central Texas to the west of Fort Worth.
The southernmost supercell developed earliest in the day in the vicinity of both the dryline and the elevated terrain west of Del Rio. This storm then paralleled US Highway 90 throughout the evening, producing not only giant hail but also an EF-1 tornado near Hondo. The Fort Worth storm intensified into a supercell by mid evening. The Norman storm did not fully intensify into a supercell until mid to late evening. Rain and thunderstorms had limited surface heating in central Oklahoma (the green areas in the surface temperature image above remained cooler owing to cloud cover), but the arrival of the surface front and strong lift ahead of the upper-level closed low proved sufficient to initiate the severe storm that impacted Norman. The critical forecast hours during which these three storms were evolving are summarized here:
Hondo, 2100–0130 UTC
Fort Worth, 2330 UTC - 0130 UTC
Norman, 0000 UTC - 0300 UTC
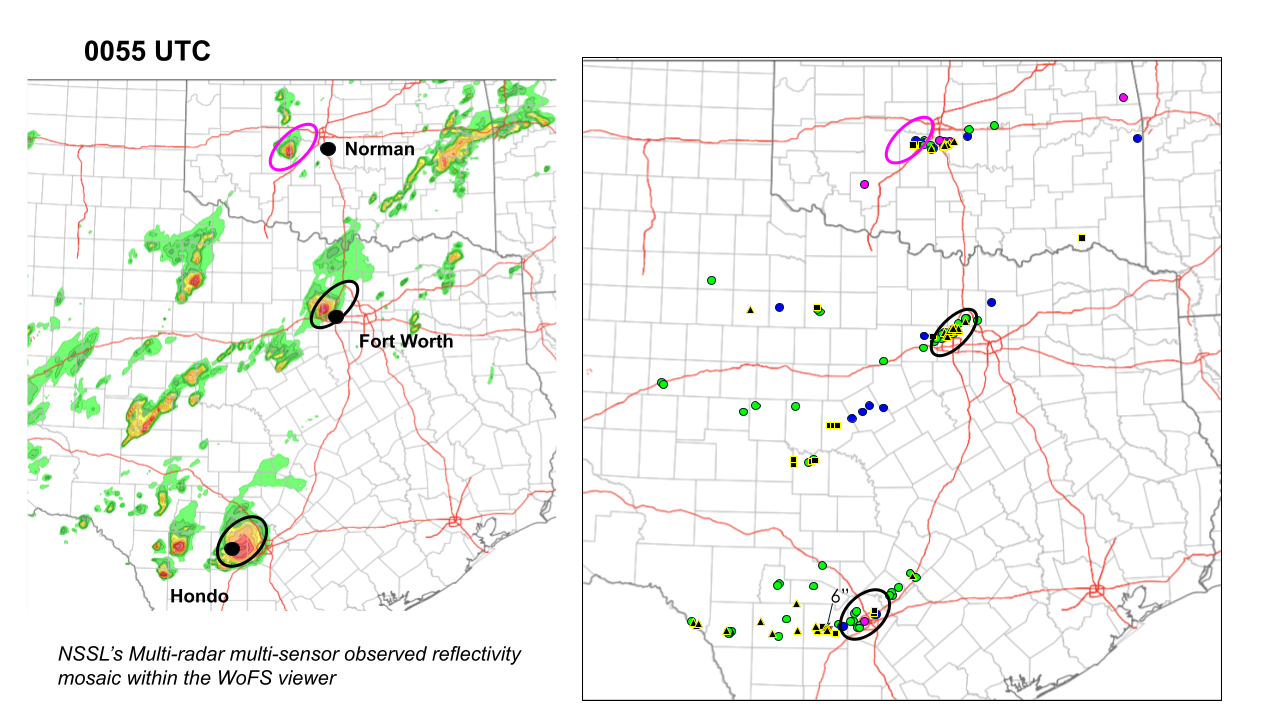
In the snapshot in time seen below, taken from 0100 UTC, the record-setting storm was just exiting Hondo, the second damaging storm was affecting Fort Worth, and the third storm was gathering steam toward Norman.
Supercell 1: Del Rio to San Antonio, Texas
When diagnosing large hail potential in WoFS, some logical “go-to” products include both probability and percentile fields for 1) updraft helicity (or UH) to identify supercells and 2) severe hail size. When using probability fields, or WoFS in general, it is important to remember that forecast performance will improve after individual storms have initiated and been assimilated into the ensemble. This was true of the Hondo storm.
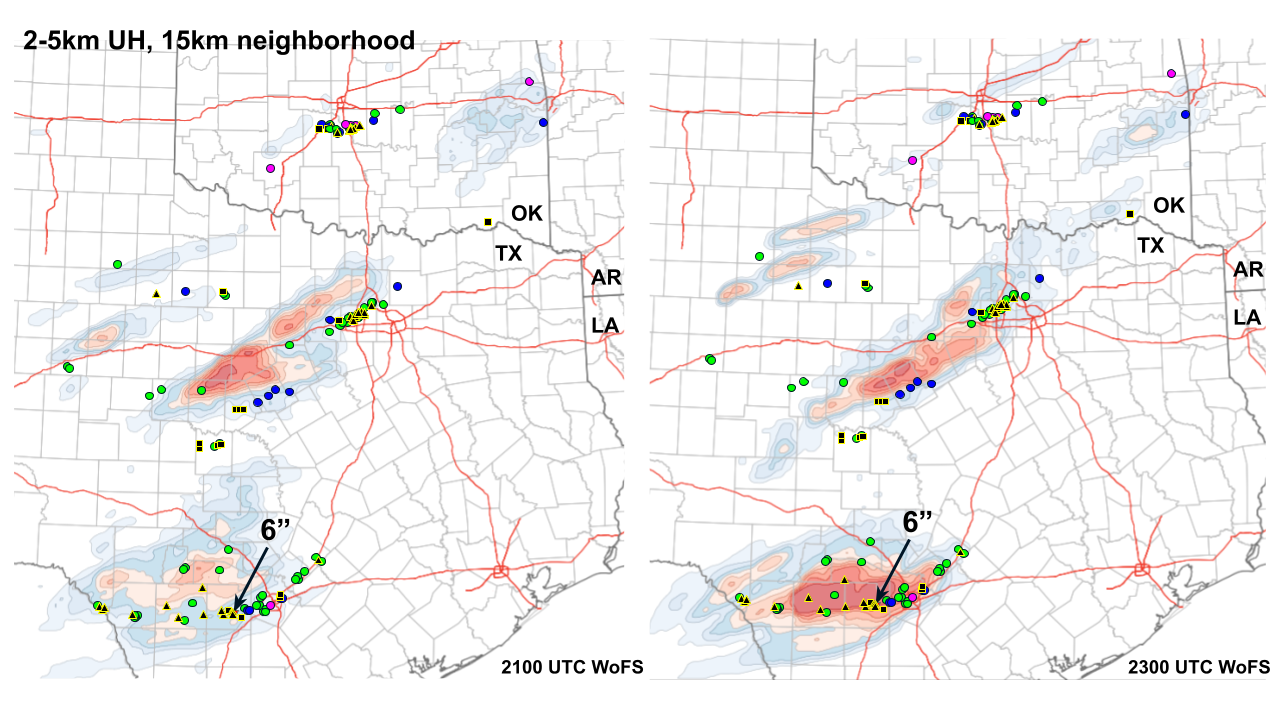
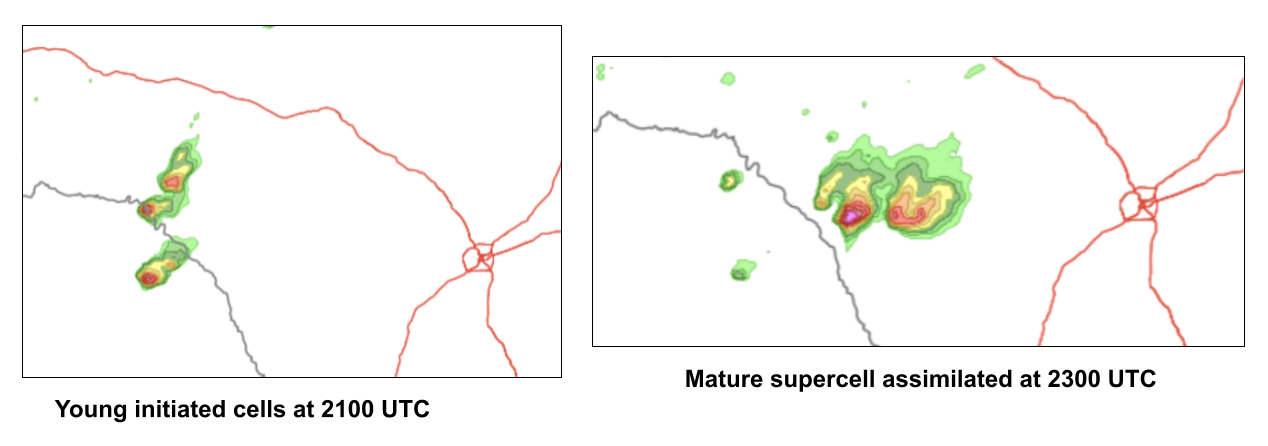
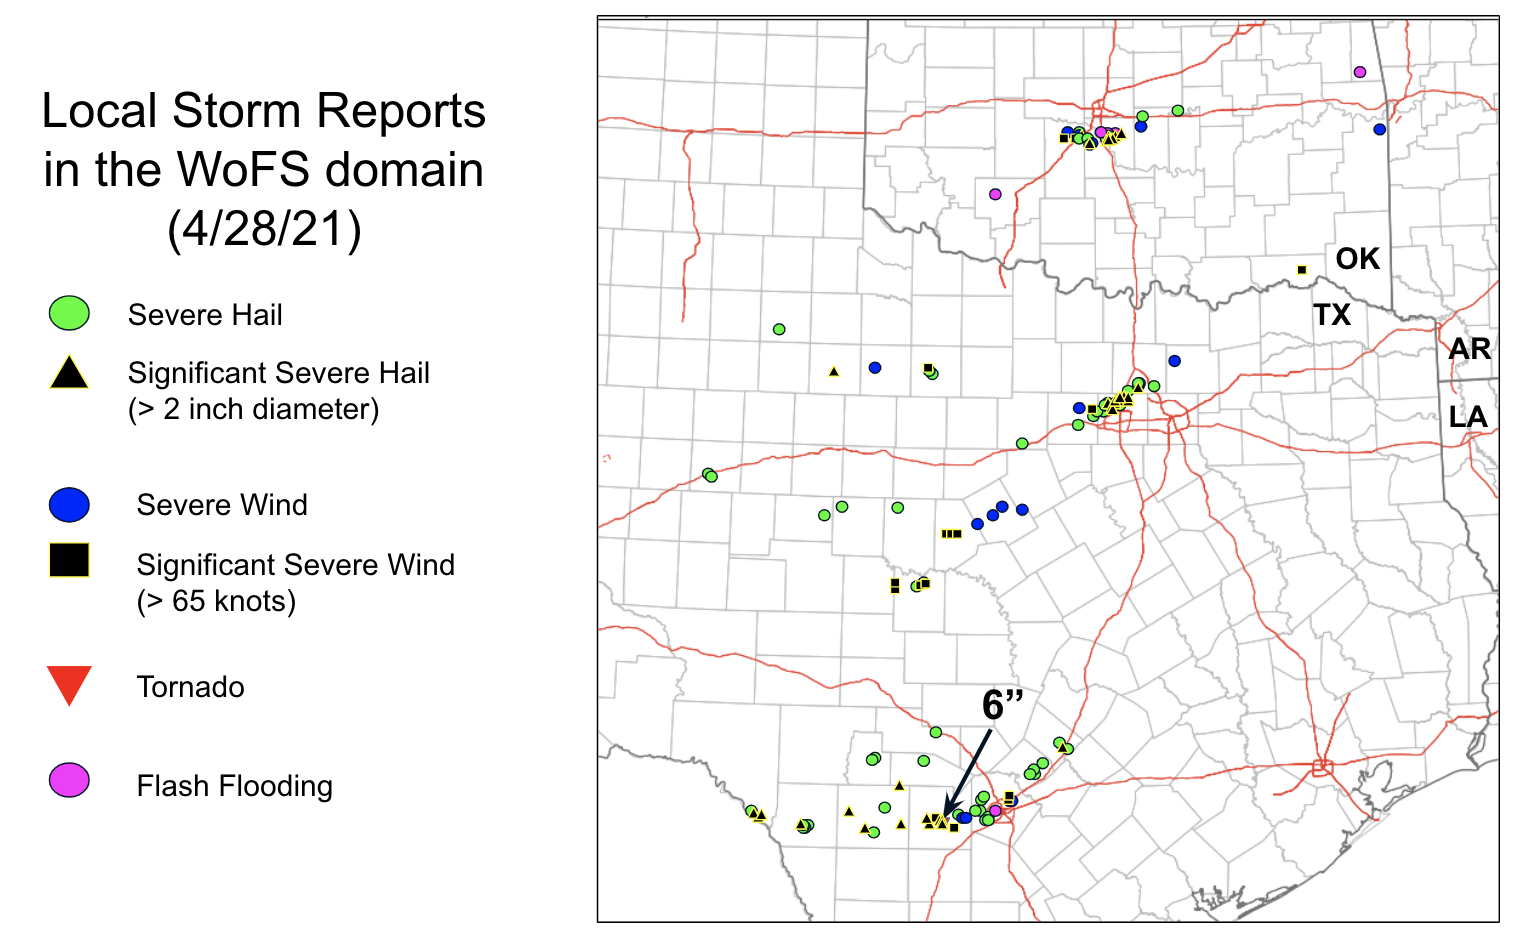
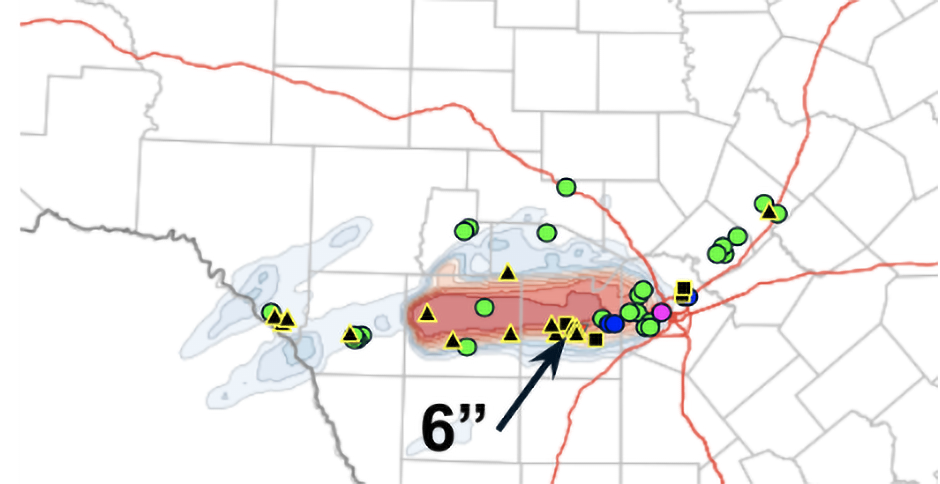
The first two panels above show ensemble swath plots of the probability of mid-level UH exceeding 60 m2 s-2, accumulated up until the time of the image, from WoFS forecasts made at 4pm CDT (left) and 6pm CDT (right). The plots are valid within minutes of the occurrence of the Texas state record hailstone at Hondo at 7:35pm; Hondo is located in the county immediately west of San Antonio (the arrow with a 6” label points to Hondo). The 4pm run occurred during convective initiation (seen in the lower left panel) without the benefit of assimilating a fully-developed supercell into the model. Still, mid range, 40-60%, probabilities were forecast around Del Rio, Texas, back to the west of Hondo. This forecast was valid shortly before the first significant hail reports occurred in Del Rio around 5pm. If seen in real-time, information like this from WoFS could help put forecasters on alert for a near-term risk of hail, though precision was lacking at the time. Once the supercell was fully matured and assimilated into the ensemble, the 2300 UTC WoFS run had a stronger ensemble signal for a supercell to travel almost due eastward, reaching the western side of the San Antonio metropolitan area in about two hours.
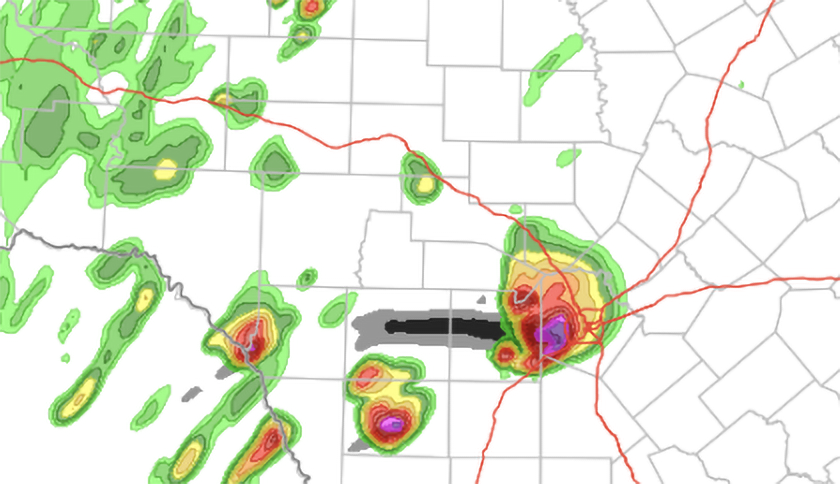
The UH plots shown above were chosen using a 15km neighborhood radius to produce the probabilities. That choice balances the ability to boost weak signals with the ability to retain some sense of county-level precision. Once a mature storm has been assimilated, however, forecasters may wish to check out the 9km neighborhood product for an even more precise depiction. Below is the 9km UH probability product from the same 2300 UTC WoFS output, along with one of the individual member reflectivity simulations depicting a very large supercell with intense UH swath.
The 2300 UTC WoFS provided a confident and accurate forecast of the supercell and intense mesocyclone track from west to east, with a little more than an hour lead time to the record hail occurrence at Hondo. But did this accuracy translate directly to predicted hail size? Unfortunately, the answer is no. Below is the Hailcast product depiction of the ensemble maximum hail size predicted between 2300 UTC and 0200 UTC. The WoFS web viewer plots a small crosshair cursor on some products along with a corresponding numerical readout in the lower right, below the legend. These cursors mark the highest value in the domain, and in this case are showing a maximum hail size of about 2.79 inches. It seems that on April 28th, the product consistently maxed out between 2.50 and 3.00 inches for hail diameter. While this is a good forecast of significant and potentially damaging hail, the predictions fall well short of the observed 6 inch stone, in spite of a very favorable thermodynamic setup and a large, intense supercell in the model.
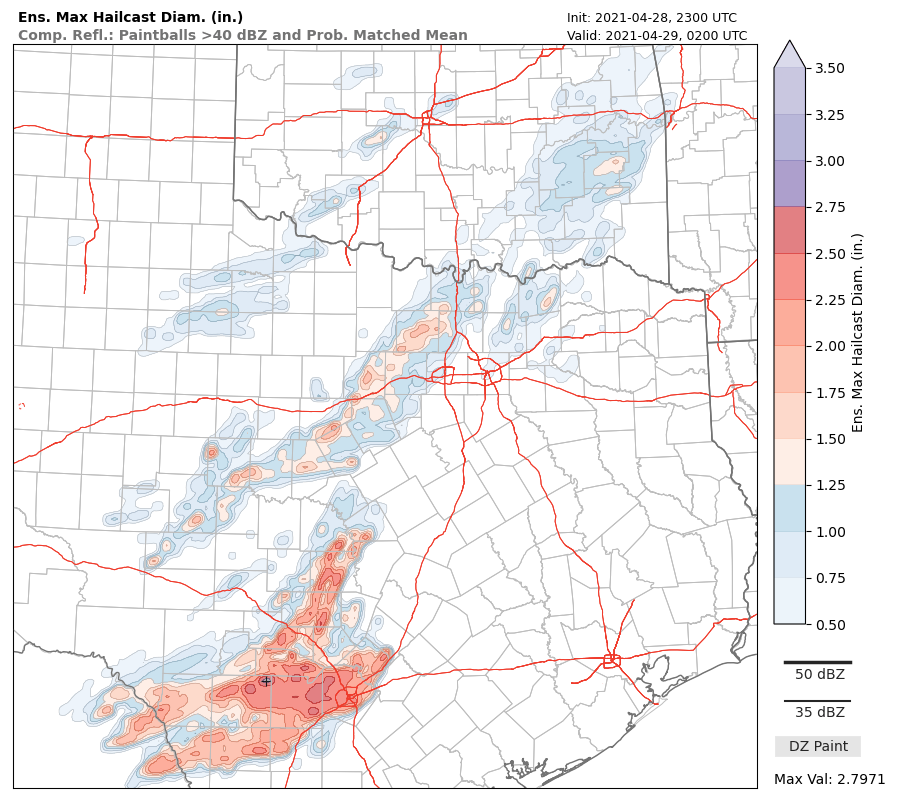
Hail size is very difficult to model, and the Hondo storm is an indication that maximum hail sizes may be underestimated by the Hailcast method used in WoFS during extreme events, even when the model is producing a large supercell in a favorable environment.
Supercells 2 and 3: Fort Worth, Texas, and Norman, Oklahoma
The other two noteworthy hailstorms of the day occurred close in time, and can be studied together. WoFS performance was not as good for these two storms.
Probability of strong mid-level UH (image) and reflectivity paintballs (overlay) [+]
Ensemble maximum hail size (image) and local storm reports (overlay) [+]
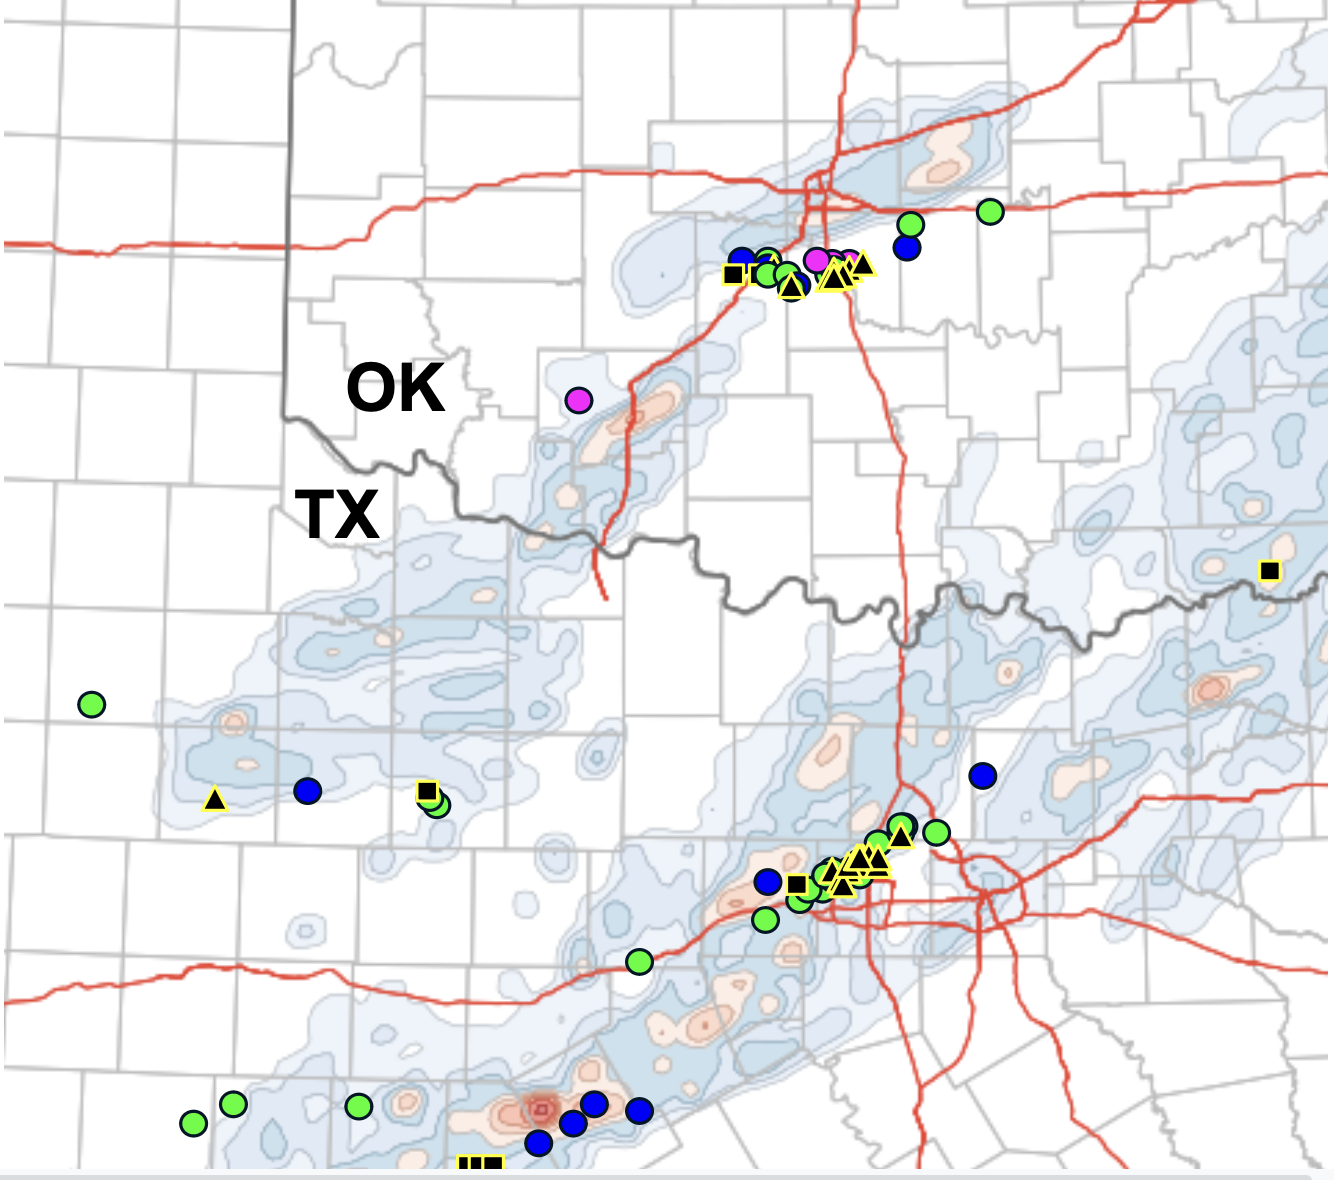
Above are a looping forecast of UH and the corresponding ensemble maximum hail size forecast from the 0000 UTC WoFS. Dark paintball clusters at the beginning of the loop show that WoFS had assimilated the storms that were approaching Fort Worth and Norman, but the paintballs soon either scatter in slightly different directions or decrease in size, as WoFS was not very confident that they would remain intact as individual long-lived storms. The resulting UH probability field shows a dramatic drop-off near Fort Worth, and the swath near Norman goes too far north while also being of modest, 20–30% probability. This forecast was made just 1 to 2 hours prior to impacts in the two cities.
Probability of severe hail (> 1-inch, , image) and local storm reports (overlay) [+]
Ensemble maximum hail size (image) and local storm reports (overlay) [+]
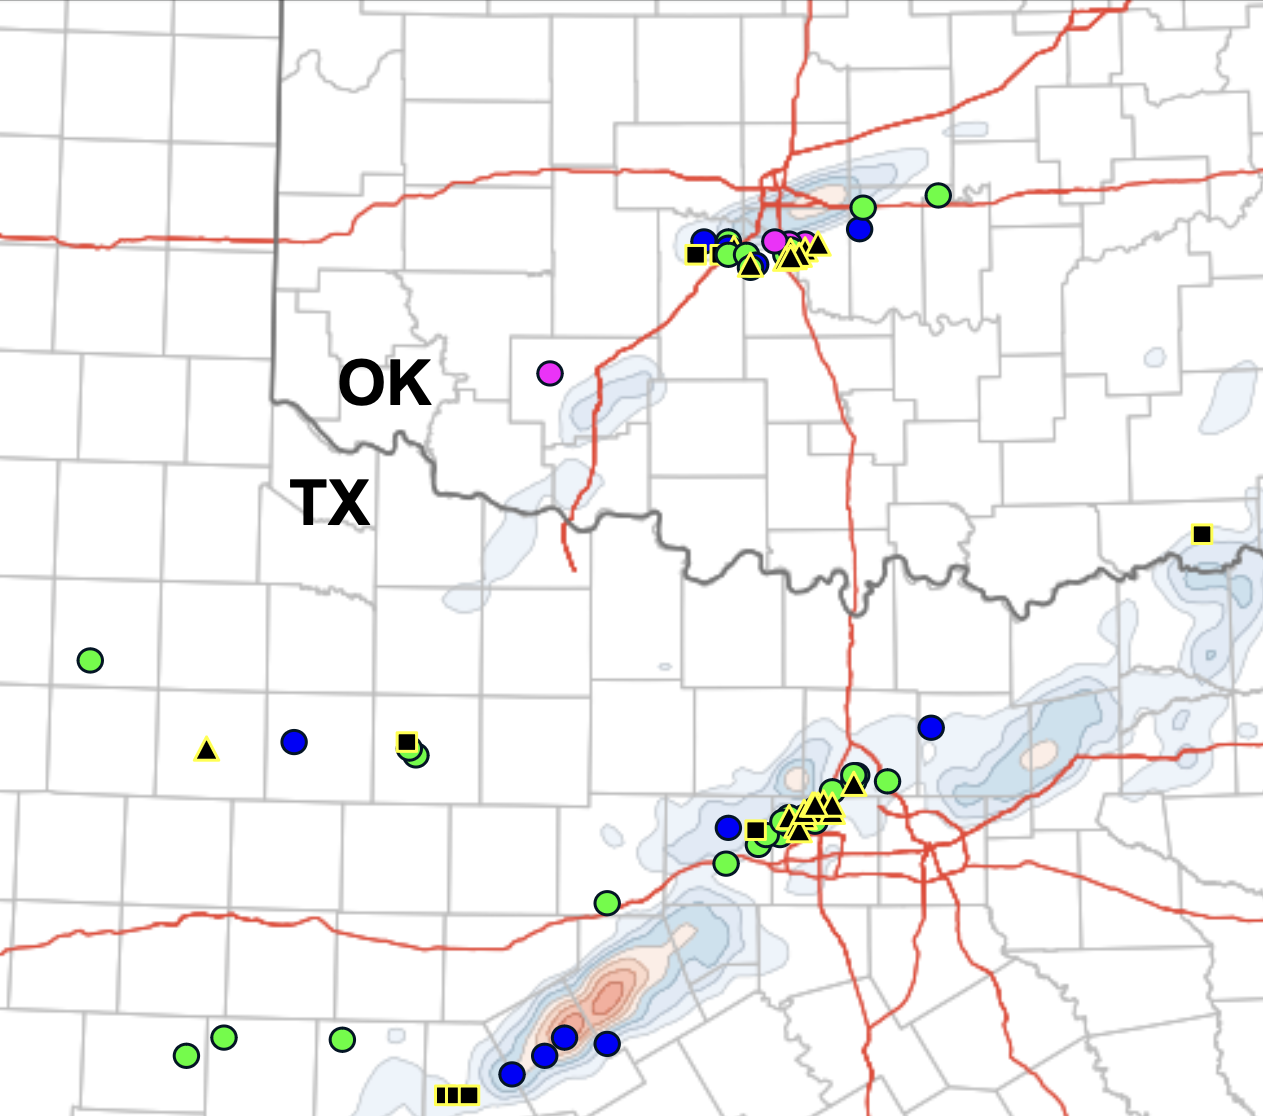
Now we advance to the 0100 UTC WoFS run. This would have been the last real opportunity for WoFS to signal any part of the Fort Worth hailstorm before it was too late. But once again the forecast was not very useful. The probability swath (left) captured more of the storm track across northern Fort Worth suburbs, but the ensemble odds of even 1-inch hail were forecast at only 20–40%. There was potential for a little greater lead time in Norman, and here the trend was favorable. WoFS trended a little farther south toward Norman. The probability values were still in the mid range, but perhaps WoFS would have confirmed for forecasters that this was the only storm in Oklahoma worth watching at the time. If forecasters were to have checked the ensemble maximum hail size for worst case scenario planning, they would have received a little more information. At least one or two outlier WoFS members were forecasting up to golf ball size hail with the central Oklahoma storm and 2-inch, significant hail in southwestern Denton County near Fort Worth.
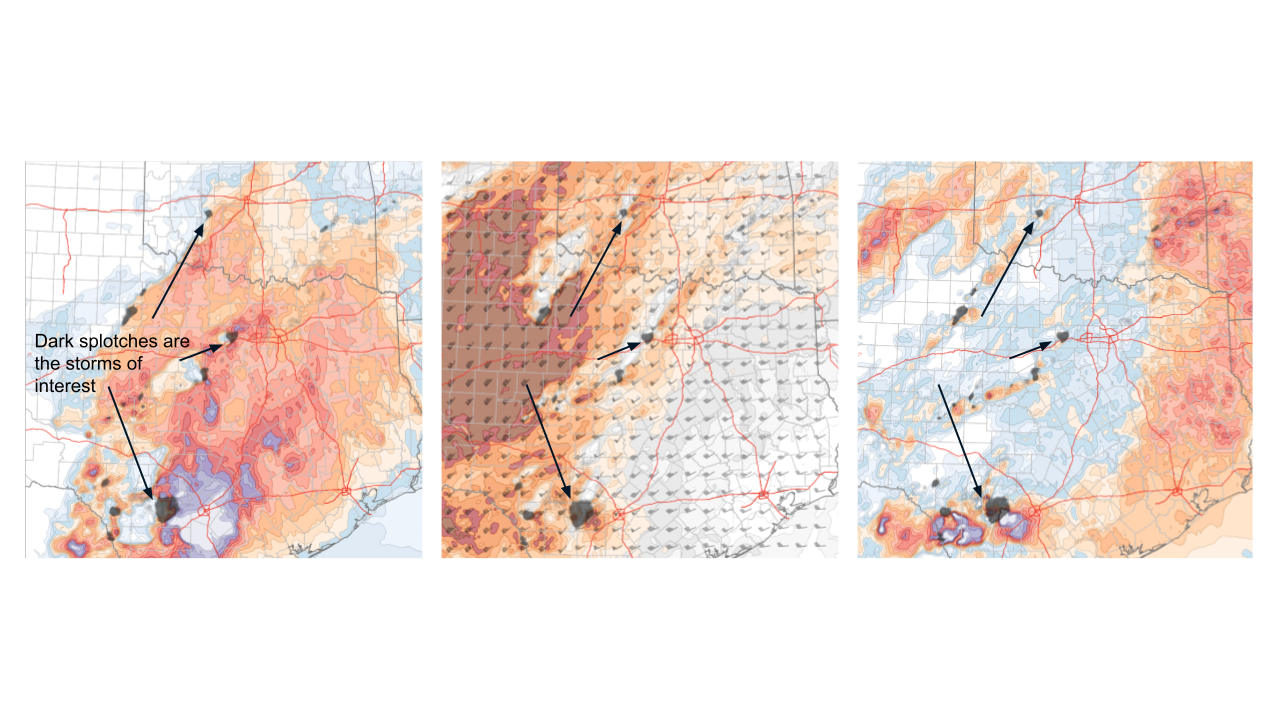
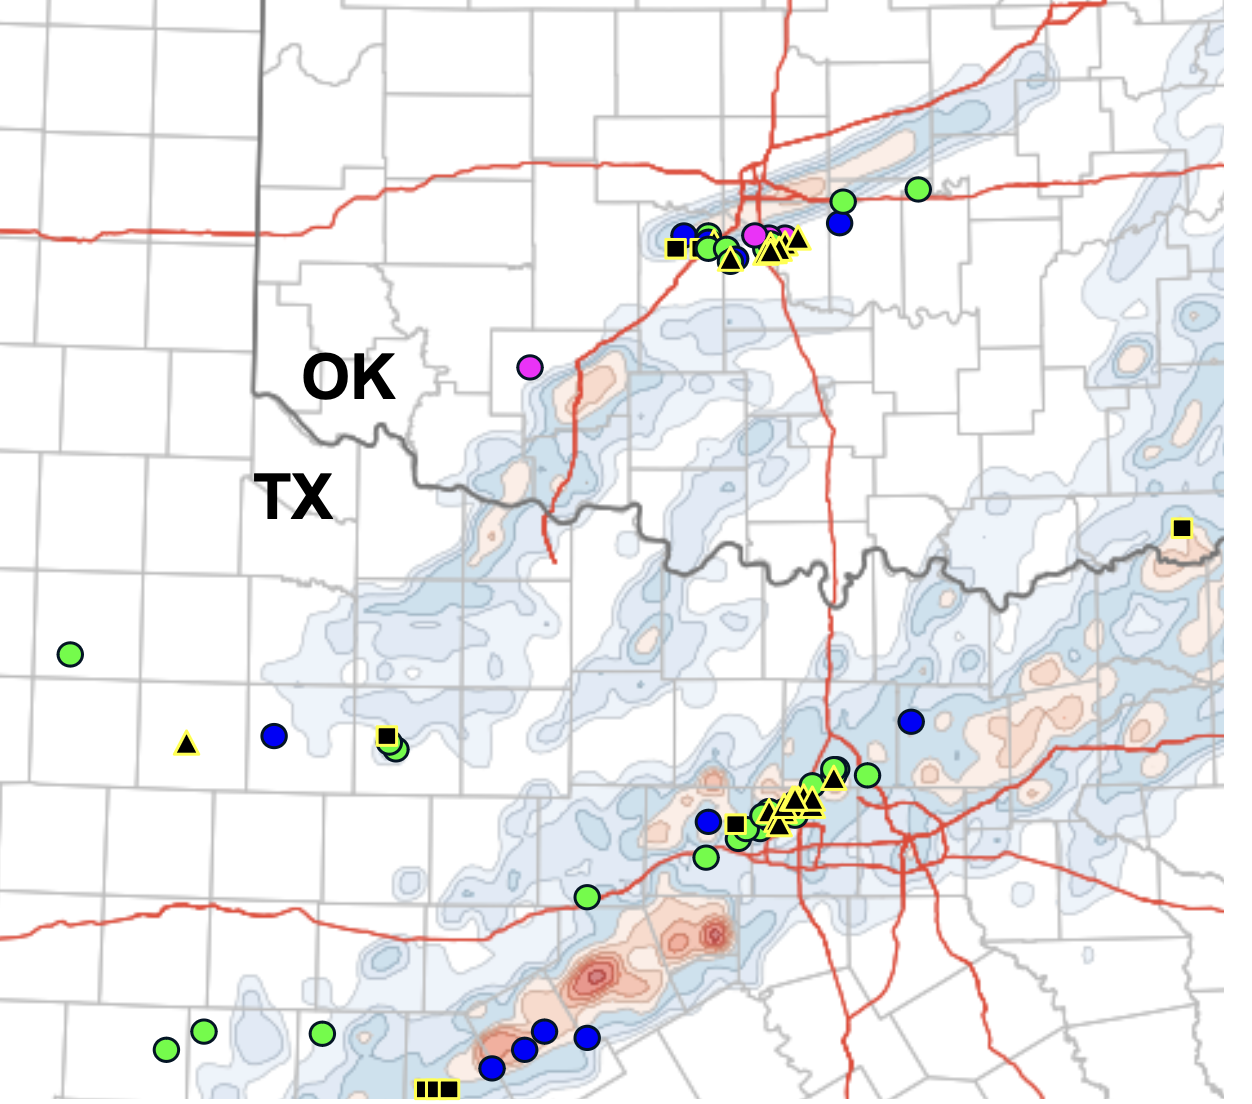
Left: Instability / SBSCAPE (0030 UTC WoFS); Center: 0–6km Wind Shear; Right: 0–3km Storm Relative Helicity [+]
It is interesting in this case to take a look at the different storm-scale environments in the context of the WoFS performance that we have shown. The environmental 3-panel image above shows instability, deep-layer wind shear, and storm-relative helicity images. Paintballs at the initial model time indicate the locations of our three storms of interest as they were represented in WoFS at the initial time step from the 0030 UTC run. The storms can be characterized as 1) Hondo: a very large storm within a local maximum of SBCAPE and SRH, 2) Fort Worth: A mid-sized storm in an area of minimal SRH but moderately strong deep-layer wind shear, and 3) Norman: a small storm more fully in an area of strong deep-layer shear and likely elevated west of the SBCAPE axis.
We might expect the best WoFS performance for the large storm that is more easily resolved and is in a very favorable environment, and that is what we see in this case. Although not shown here, a quick inspection of the member reflectivity simulations of the Fort Worth storm show widespread initiation of new cells along the flanking line of that storm, and generally too much initiation of additional convective cells in some WoFS members. This would act to produce mergers and cause competition among individual storm cells in the model, limiting the potential of any one of them to produce significant severe hail or sustained mid level rotation. It is often difficult to prevent cells from forming within WoFS in places where conditions are favorable (for example, this was just after peak heating on an unstable day with plenty of synoptic scale lift). At Norman the story was a little more promising. Although the location remained too far north in WoFS, the ensemble did trend toward higher probabilities, and a few individual members were indicative of a potential long-track storm with a potent mesocyclone. This is an example of a low-probability, high-impact event, which is something forecasters can watch out for when using WoFS. The earlier rain and cloud cover in Oklahoma had meant that forecasters there were not dealing with any severe storms during the afternoon, and the WoFS forecasts show potential to be used as a heads up for the one area where a significant storm might occur during the evening hours.