
Warn-on-Forecast Case Studies
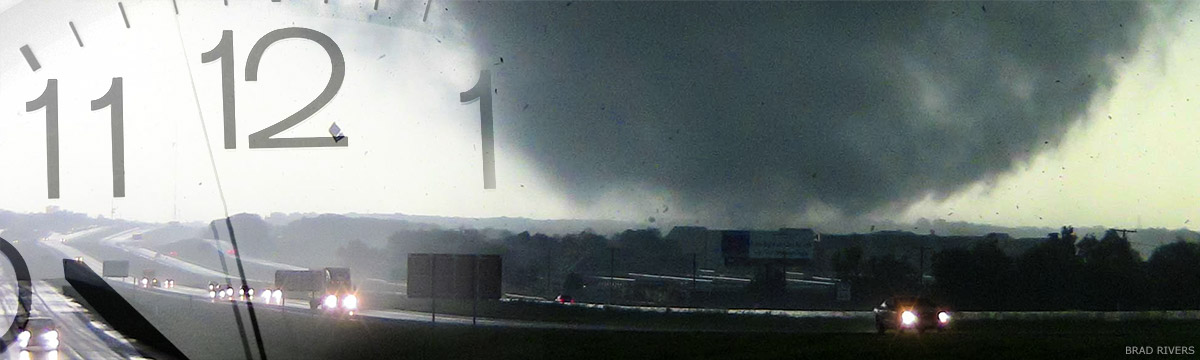
Tornado event at Elk City, OK, May 16, 2017
WoFS influences lead time on the damaging and deadly Elk City, OK, tornado
May 16, 2017, was a milestone day in the history of our science’s move toward Warn-on-Forecast. This was the first time that real-time forecasts from WoFS directly influenced the way a local NWS Weather Forecast Office handled messaging for a potential tornadic storm. While the eventual goal is for the WoFS ensemble to deliver guidance that is so compelling as to trigger NWS warnings an hour or more in advance, an important first step is to deliver guidance that enables more specific forecast messages at greater lead time in products and services other than warnings. During this event the NWS Weather Forecast Office in Norman, Oklahoma (WFO Norman) saw storms developing in the Texas panhandle, they knew the environment was favorable for further strengthening and rotation, and, working with an embedded NSSL scientist, they saw consistent WoFS forecasts that suggested these storms would become a tornado threat when moving into western Oklahoma within a couple of hours. The office then issued a Significant Weather Advisory which stated, “Severe weather is likely with these storms as they move into Oklahoma and there is a high probability that tornado warnings will be issued.”
The language in this advisory was unlike language that is typically used. Forecasters usually allude to the potential for the weather to become more threatening, but stop short of predicting their own future warnings. Language in a public product that is this direct, “...high probability that tornado warnings will be issued…” likely grabbed the attention of media and emergency management partners and members of the public. Indeed, the WoFS forecast was quite accurate; the storms did later produce tornadoes, and WFO Norman did issue the tornado warnings they had predicted would be needed. You can read below for more details about this event, and to see WoFS output. Meanwhile, the following quotes emphasize how well this forecast process worked:
“We used this model guidance to forecast with greater confidence and greater lead time.” - Todd Lindley, Science and Operations Officer at WFO Norman
“Based on the information from the NWS we were able to activate outdoor warning sirens about 30 minutes ahead of the tornado.” - Lonnie Risenhoover, Elk City Emergency Manager
Meteorological Setup
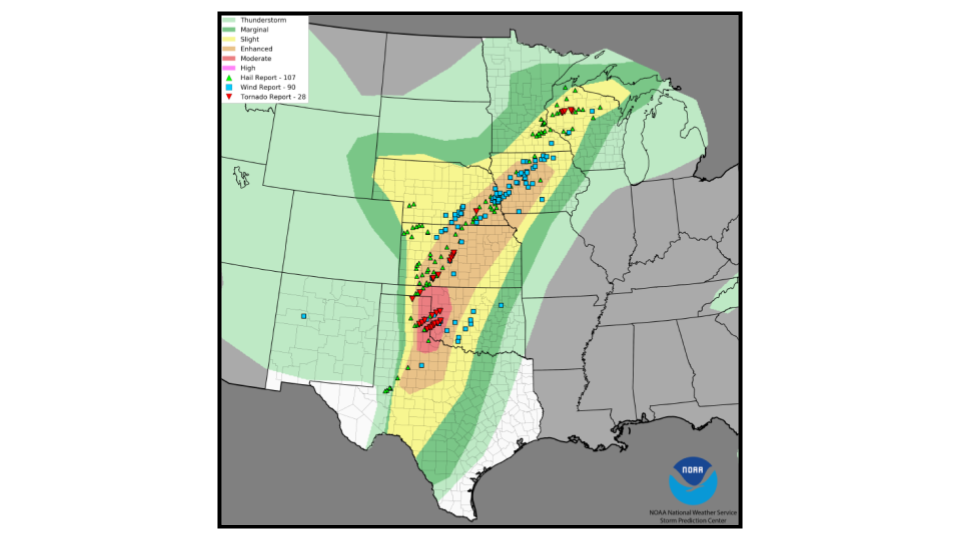
As of midday on May 16, 2017, the Storm Prediction Center’s Day 1 Convective Outlook included Slight Risk (yellow) from Texas to Michigan, Enhanced Risk (orange) from Texas to Iowa, and Moderate Risk (Red) over the Texas panhandle and western Oklahoma. [+]
This was a case of broad and strong southwesterly mid- and upper-level flow over the Great Plains, with a dryline preceding a Pacific cold front over the southern Plains, and strongly unstable air ahead of the dryline owing to adequate Gulf moisture return and adequate daytime heating. All of these things are typical of spring severe weather days, so we will not spend any time picking apart the large scale setup. Some of the remaining challenges in these scenarios are to forecast where the strongest thunderstorms will be most concentrated over the space of a handful of counties, which hazards are most likely to occur (e.g., tornadoes versus straight-line winds), and how early we can tell specific communities about individual thunderstorms which may affect them. WoFS strives to help meet these challenges.
Observed mid-level conditions (500 mb) on the morning of May 16, 2017; plot from the Storm Prediction Center. [+]
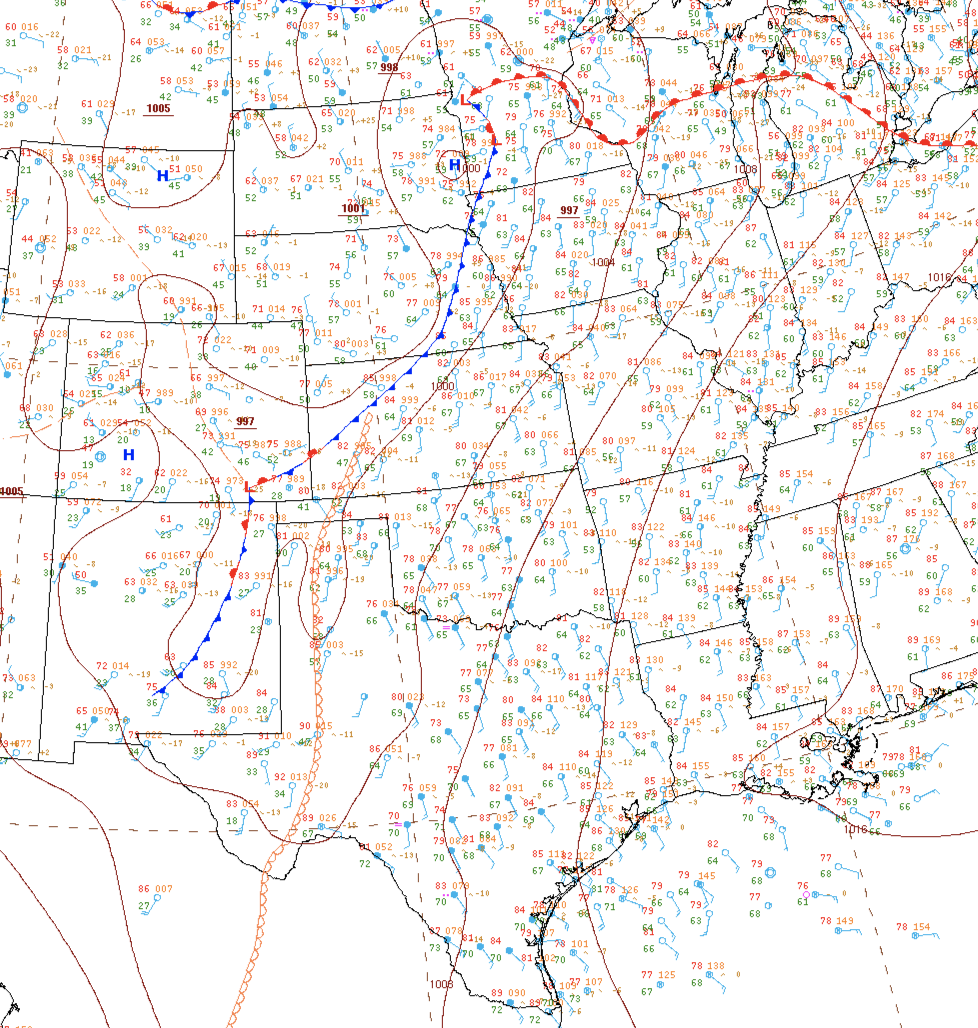
Surface analysis from 1:00pm Central Daylight Time (18Z) on May 16, 2017; analysis from the Weather Prediction Center. [+]
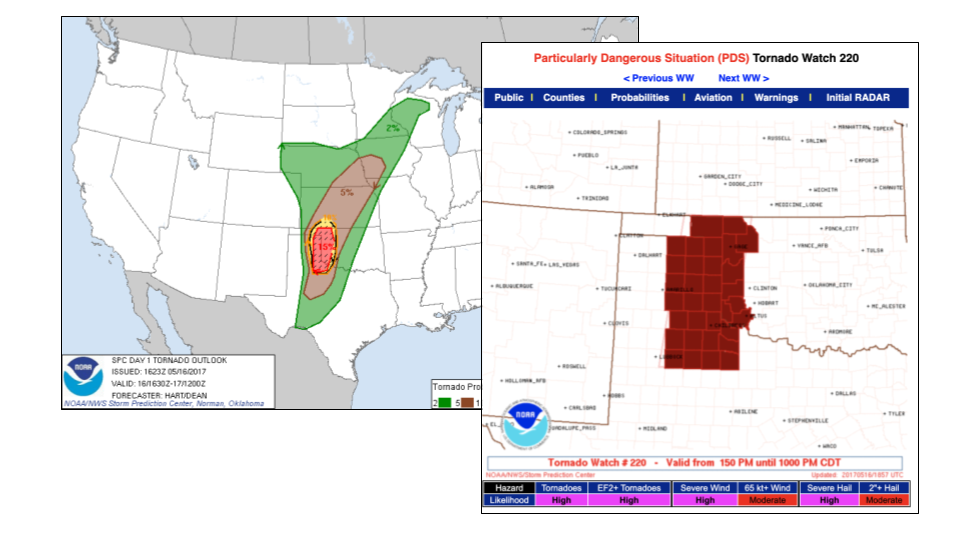
It is worth noting that the SPC Moderate Risk area included a 15% probability of tornadoes within 25 miles of a point, and included hatching to indicate the possibility of significant tornadoes (EF-2 or greater). A Tornado Watch using the “Particularly Dangerous Situation” tag was issued at 1:50pm Central Daylight Time, so forecasters were preconditioned to expect significant tornadoes on this day.
The 2:00pm Central Daylight Time run of WoFS, just after the Tornado Watch was issued:
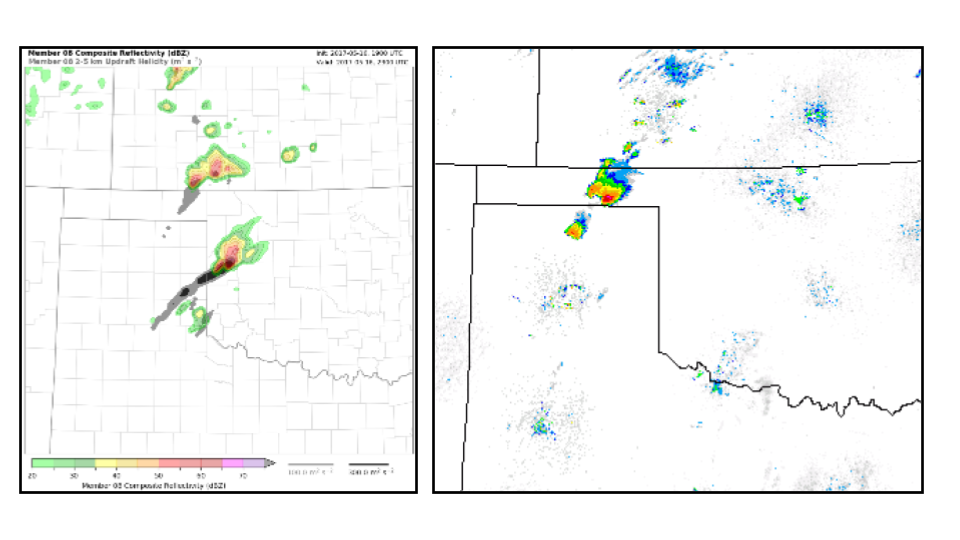
Output from WoFS (left) showing simulated radar reflectivity from one member of the ensemble, along with a swath of updraft helicity (a measure of rotation in storms, the dark gray shading) from that same member. Plots like this show the simulated radar at a specific moment in time (a few hours later in this case) while the updraft helicity swath represents all of the elapsed time between when the model run began and when the forecaster stopped the loop. These swaths can show us the path the storm has taken during the model run, as well as the history of its intensity (darker black blobs indicate times when the modeled storm is strongest).
Observed radar image (right) at the time this WoFS run was initiated. WoFS was predicting that the existing storms would move into Kansas, but that a storm with strong rotation - likely a supercell - would soon develop in the Texas panhandle and move into western Oklahoma.
The 4:00pm Central Daylight Time run of WoFS, just as storms in the Texas panhandle are rapidly developing:
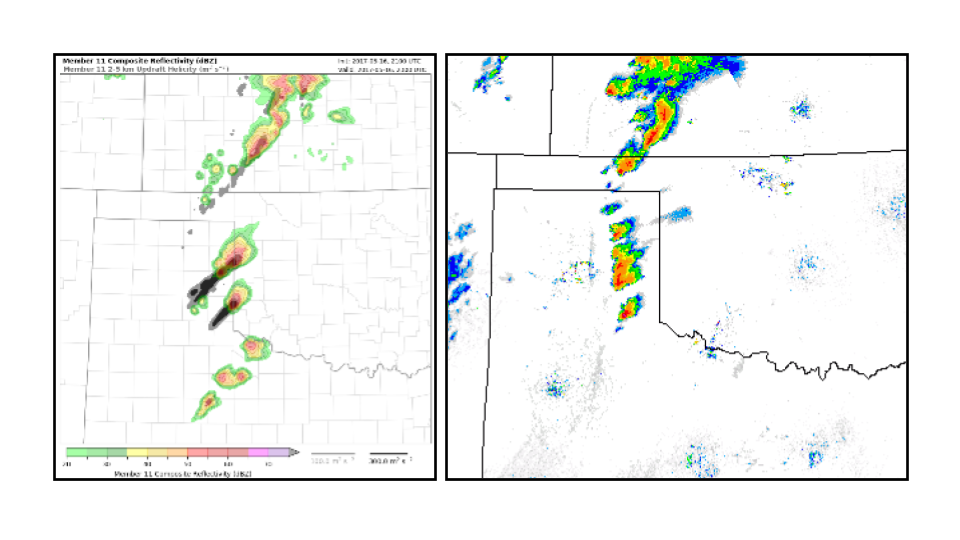
In the Great Plains, it can be a chaotic hour when the cap breaks and numerous thunderstorms develop at once (observed radar, right-hand image), all competing for inflow and crashing into one another. Sometimes these crashes, or mergers, create one large and strong storm, and at other times the mergers can cause storms to dissipate, meaning the possible outcomes range all the way from a dangerous rotating storm to no storm at all ! This is where a tool like WoFS can help to make sense of the chaos, and allow forecasters to give information to the public with greater confidence. In this case the newly arriving WoFS information (left) continued to show the one supercell thunderstorm emerging from this mess and moving into western Oklahoma, but it was now showing a second supercell storm with strong rotation just a little farther south. Forecasters recognized that if this second storm was able to take hold, it would be a potential threat to Interstate 40 and the city of Elk City, OK.
The 5:00pm Central Daylight Time run of WoFS, as the more dominant supercells are emerging from the initiation area:
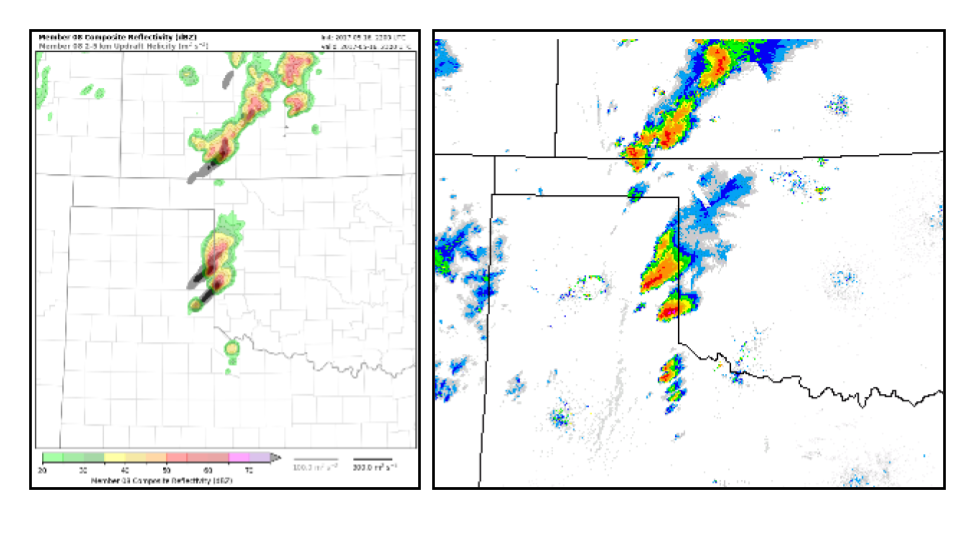
One hour later, two important things had occurred: two dominant storms emerged from the area of initial storm development and merging (observed radar, right-hand image), and more WoFS output arrived, telling the same story as before. Forecasters could now see that WoFS was consistently depicting two distinct supercell thunderstorms, both with strong rotation, and one of which would approach Elk City. They could also see that the real-world storms were behaving very similarly to the WoFS predictions. When the early part of a model run can be verified against what is happening in the real world, this gives forecasters greater confidence in using the model to make predictions farther out in time, which is especially true if the model is behaving consistently from one run to the next as WoFS did between 4:00 and 5:00pm. This confidence boost is what caused forecasters at WFO Norman to issue the unique advisory at 5:45pm which stated that tornado warnings were likely to be issued.
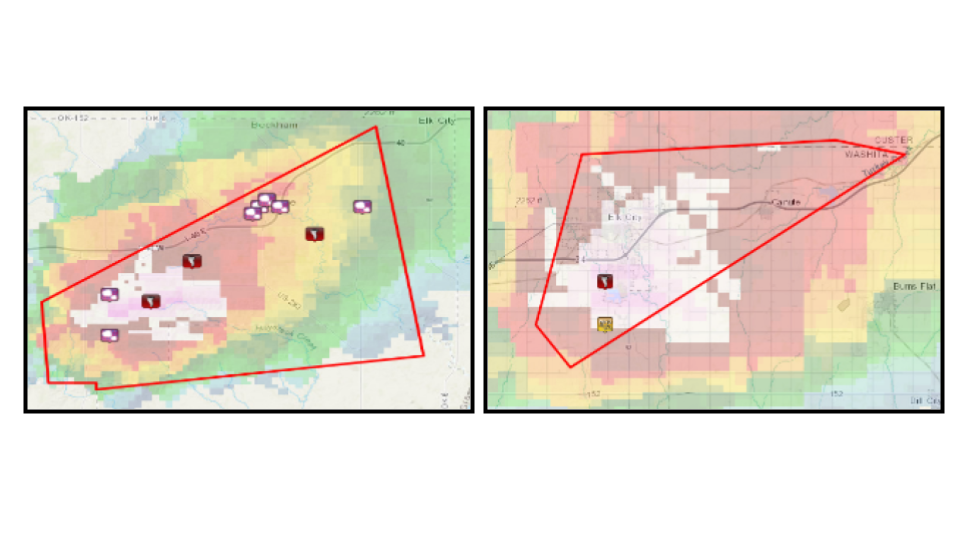
Using WoFS probability and percentile forecasts in tandem:
The bread and butter of a probabilistic forecast tool like WoFS are probability plots and percentile plots. Getting the most out of these plots, however, especially in warning operations, was not something that had been in regular practice prior to WoFS. The above images show some very useful forecast information for the Elk City tornado from the 4:00pm run of WoFS. In these images the hollow black contours which move along from southwest to northeast represent the average radar depiction of the storms in the 18 WoFS ensemble member forecasts. The color-filled probability swath on the left shows very high probabilities of strongly rotating storms coming into western Oklahoma. Notice that the probability values decrease as time progresses, but this is actually to be expected during any ensemble run, no matter how favorable the environment is for rotating storms. This happens because minor variations among the 18 forecast members will cause storms in the model to spread out a little bit over time. They may all be continuing to carry a strongly rotating storm, but the probability of strong rotation at any single point will decrease because of the spread in locations. What forecasters can say, though, is that in this case we are looking at two supercell thunderstorms in an environment that should support them for a few more hours, and the average WoFS radar depiction continues to carry those two storms forward well into the future.
Then turning to the right-hand side, we see the same average radar depiction now plotted atop a swath plot of the 90th percentile of updraft rotation strength. Because an ensemble contains multiple member forecasts, we have no reason to use any particular one of them to characterize the expected storm strength. Instead, the members produce a whole range of forecasts depicting the potential storm strength, represented by a numerical value of updraft helicity (storm rotation). We can use the distribution of these values to choose different lenses for viewing storm strength. We could look at the 10th percentile to see a best case scenario (i.e., “90 percent of the forecasts are stronger than this value, but maybe we’ll get lucky and have a weaker storm”). Forecasters are usually more interested in guarding against and preparing the public for the worst case scenario, so WoFS provides plots of 90th percentile and 100th percentile (100 is labeled as MAX). The 90th percentile of a distribution is often referred to as the “reasonable worst case scenario,” meaning that the 100th percentile is worse, but it often includes outliers which can be unrepresentative of the more likely reality.
In the Elk City case the 90th percentile swath of updraft helicity shows rotation actually getting stronger over time into the first couple of hours beyond the 4:00pm start time of the model run. In fact, a tiny crosshair is plotted very near the location of Elk City. These single crosshairs on WoFS plots indicate the location of the maximum value on the screen. The numerical value associated with the crosshair is written just beneath the vertical color-fill legend when using the WoFS viewer. Looking specifically at Elk City and using these two plots in tandem, we have a moderately probable event (probability 50-70% near Elk City) with potentially severe impacts (very strong rotation). Although this is not the only information forecasters were using, the WoFS information further boosted their confidence to issue the unique Significant Weather Advisory.
Tornado Warning!
At 6:13pm (left), 28 minutes after the Significant Weather Advisory, WFO Norman issued its first Tornado Warning on the southern storm. Tornado Warnings that included Elk City were issued at 6:45pm and 7:08pm, but remember that the heads up language had been given in an official product about one hour before Elk City was under a warning.
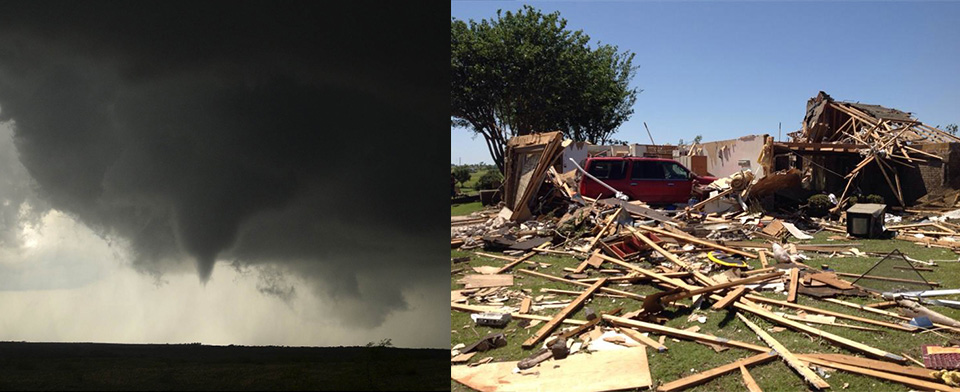
The Elk City tornado lasted 26 minutes, covering 15 miles, and was up to 1000 yards wide. The tornado caused $25 million in damage, injured 10, and sadly resulted in one fatality. The forecast and warning process was a success, however, and likely reduced the number of injuries. For the first time, a local forecast office demonstrated the Warn-on-Forecast concept in real-time operations, providing a tangible story that researchers can use to educate other offices as we attempt to reproduce this result for more weather events around the country.