

PARISE Research
Examining Tradeoffs of Mechanical Adaptive Scanning
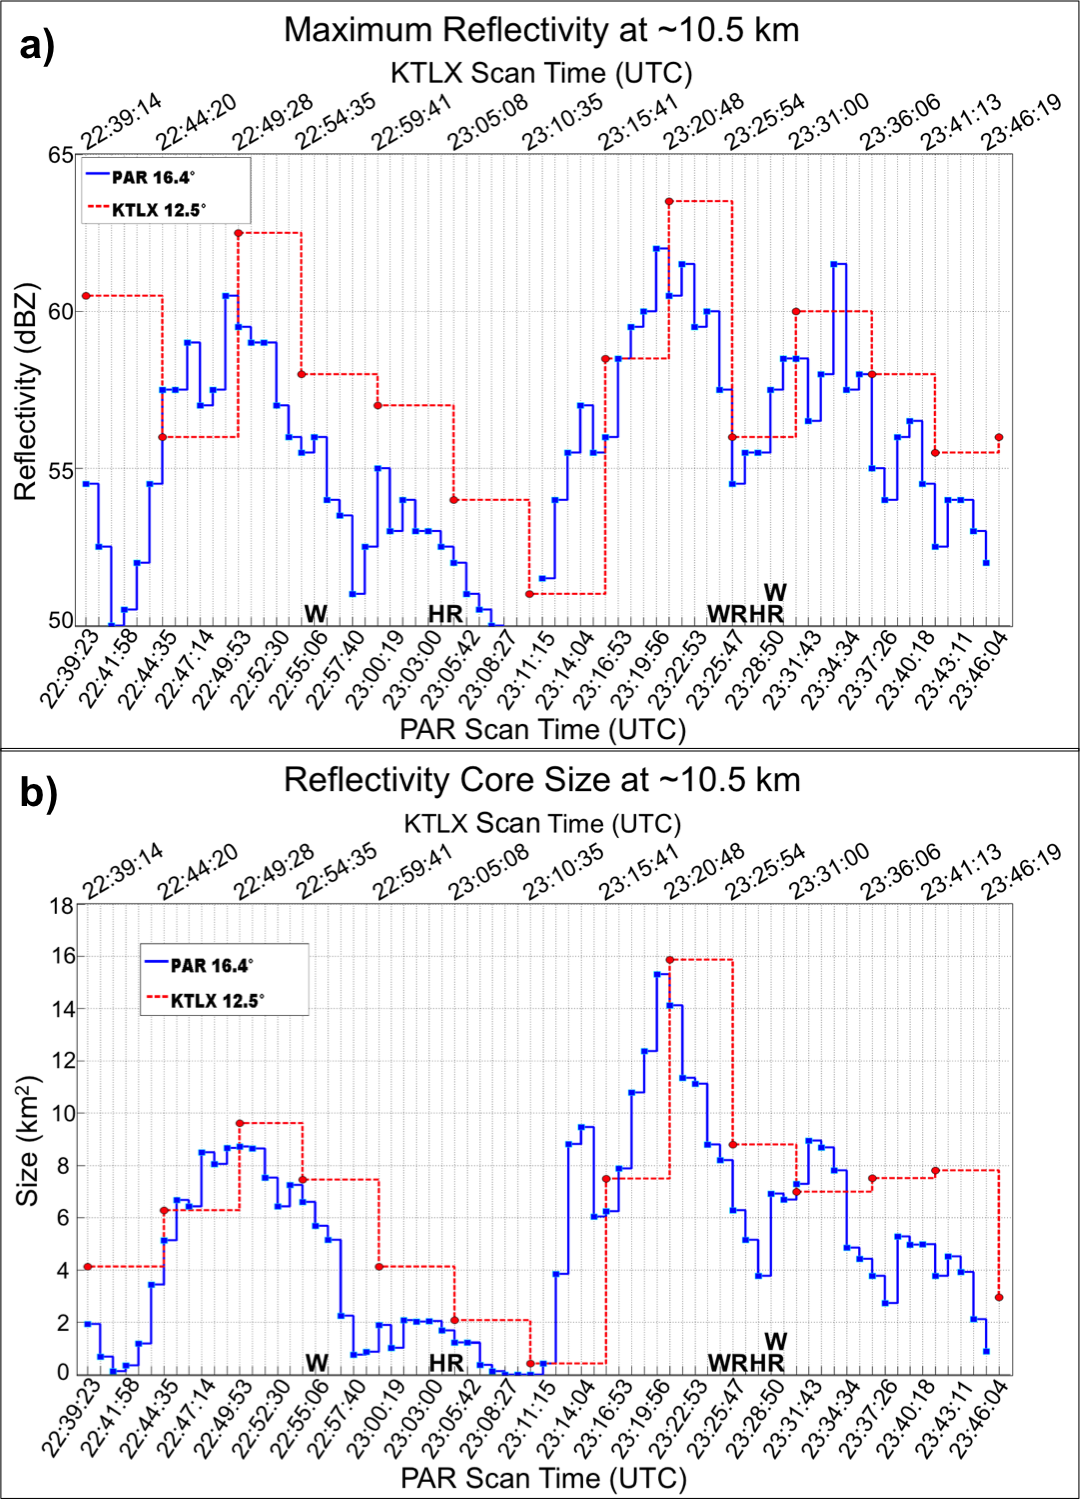
Comparison of one-minute volume scans collected by NSSL’s Phased Array Radar (PAR) (in blue) and five-minute volume scans collected by the nearest Weather Service Radar (KTLX) (in red). [+]
A recent collaboration between NSSL/CIMMS researchers and a forecaster at the Norman National Weather Service forecast office explored potential advantages of electronic adaptive scanning of phased array radar vs mechanical adaptive scanning of the current radar system, for a severe hail and wind event that occurred on July 8, 2014 in central Oklahoma. By comparing the one-minute volume scans collected by NSSL’s Phased Array Radar (PAR) and five-minute volume scans collected by the nearest Weather Service Radar (KTLX), the research team concluded that PAR data was most advantageous in:
- observing rapid changes in upper-level reflectivity cores that proceeded severe hail and wind reports,
- detecting short-lived reflectivity cores that persisted for only 5–10 minutes and,
- depicting trends in downburst precursor signatures that occurred up to 12 minutes prior to downburst maximum intensity.
These advantages were observed despite the use of a new scanning technique known as SAILS, which allowed the Weather Service Radar to collect 2.5-minute data relatively close to the ground. The use of SAILS improved the detection of low-level downburst signatures in this case, but this improvement came at the cost of KTLX detecting important mid and upper-level features due to the slower update time (adaptive: 5.1-min vs. non-adaptive: 4.2-min) of the entire volume scan. For more information, contact Charles.Kuster@noaa.gov.
Algorithm for filling weather radar data voids
A novel algorithm for filling data voids contaminated by low signal-to-noise ratio, range folding or bad data within an important region of a severe storm is being developed at NSSL.
In (a), the contoured Doppler velocity (m s-1) signature surrounding the Newscastle-Oklahoma City-Moore tornado at 1957 UTC on 20 May 2013 at 0.5o elevation angle as seen from Oklahoma City Terminal Doppler Weather Radar is masked by missing data (solid black cells). In (b), a variational technique is used to fill in data voids with values that minimize the average gradient of Doppler velocity, as indicated by black grids. The technique does not modify the original data outside the filled-in data. Positive and negative Doppler velocities, respectively, represent flow away from and toward the radar, as highlighted by red and green shadings. White zero Doppler velocity shading represents flow perpendicular to the radar viewing direction. For more information, contact Vincent.Wood@noaa.gov. [+]