DOPPLER RADAR AND WEATHER OBSERVATIONS
Richard J. Doviak and Dusan S. Zrnic
Color Plate 3
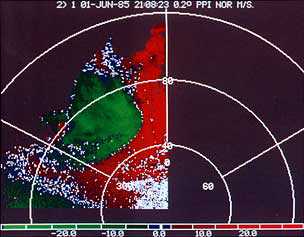
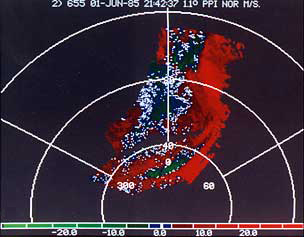
(a) The Doppler velocity field of a density current from a cluster of storm cells that passed through central Oklahoma on 1 June 1985. The elevation is 0.2°. Velocity/color scale is as in Plate 1(a), except the white color tags areas where velocity is near zero. larger image
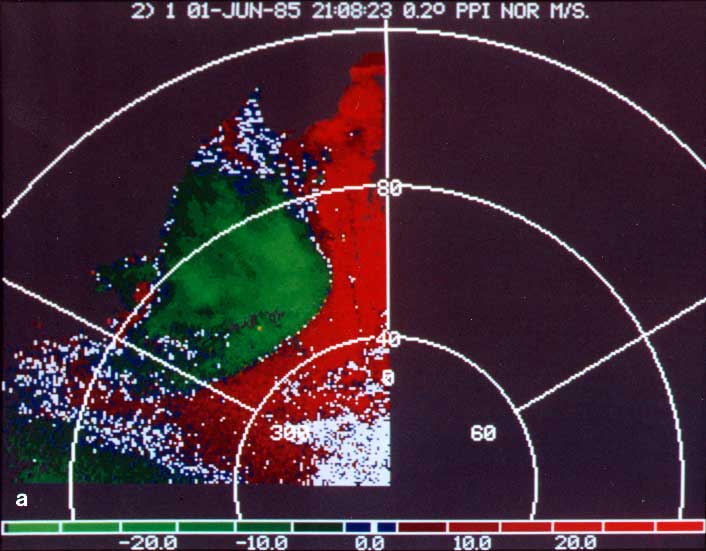
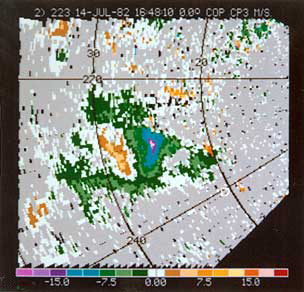
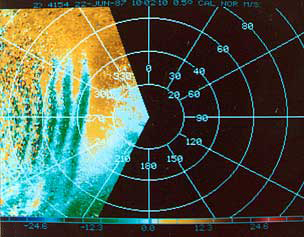
(b) Doppler velocity field of a microburst near Denver, Colorado. The elevation is 0°, range arcs are at 20 and 30 km, and the velocity scale (in m s-1) is on the bottom. (Courtesy of J. Wilson, NCAR.) larger image
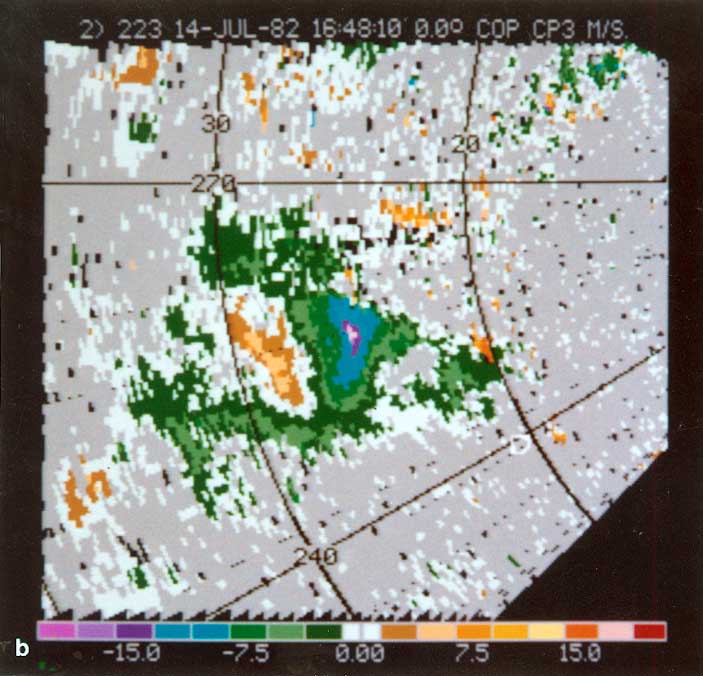
(c) The Doppler velocity field for one of a pair of solitary waves launched by the density current seen in (a), but 34 min later. The wave appears as a strip of negative velocities (band of green) at a range of about 20 km (at its nearest point). larger image
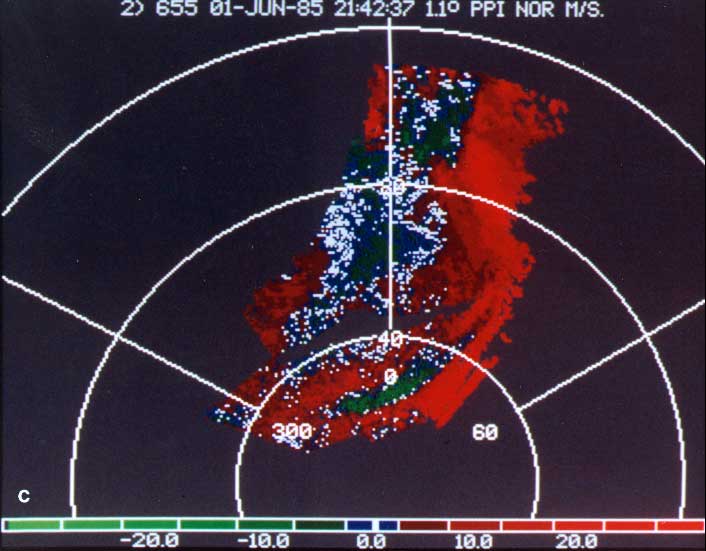
(d) The Doppler velocity field of an undular bore that propagated over central Oklahoma on 22 June 1987. (A satellite image of clouds produced by this wave is in Fig 9.43.) Range circles are in kilometers and the velocity/color bar scale is at the base of the figure. The elevation angle is 0.5°. larger image
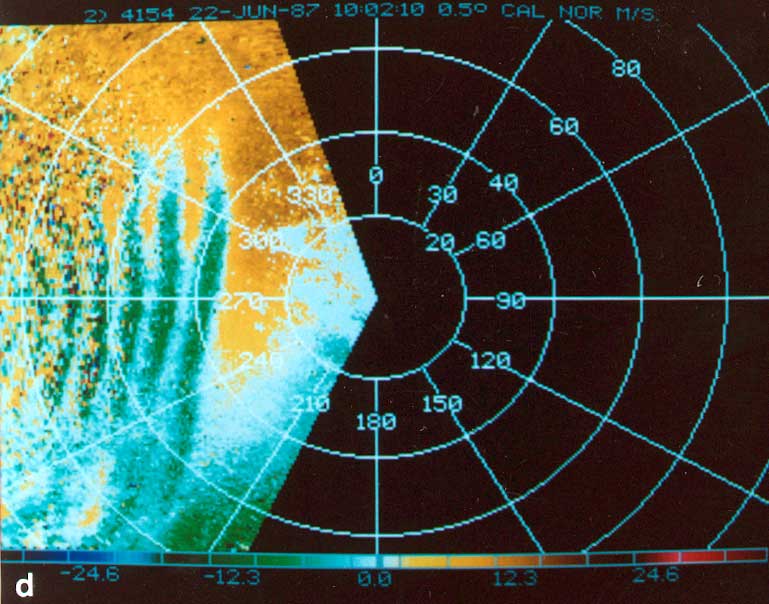
Plate 1 | Plate 2 | Plate 3 | Plate 4
« Return to NSSL Books