DOPPLER RADAR AND WEATHER OBSERVATIONS
Richard J. Doviak and Dusan S. Zrnic
Color Plate 2

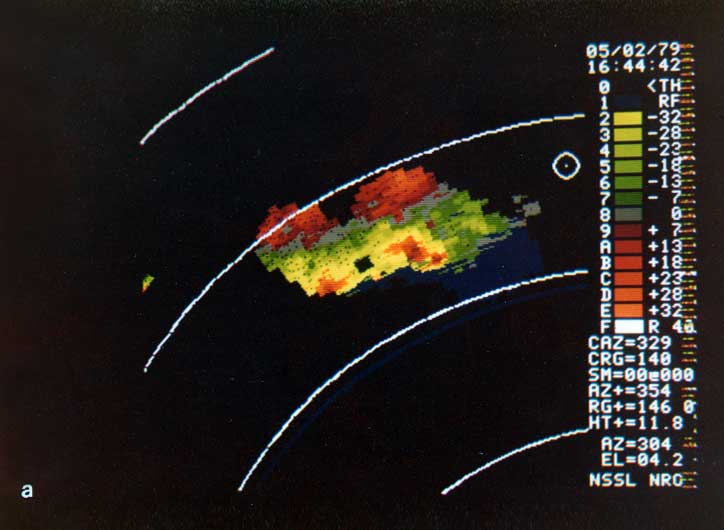
Doppler velocity fields. Color categories are in Plate 1(a).
(a) The Doppler velocity field for divergent flow near the top of storms in northwest Oklahoma, 2 May 1979. (PPI displays of reflectivity and spectrum width are shown in Fig. 9.20.) Range and height of the data field are about 150 and 12 km, respectively; range arcs are 40 km apart. larger image
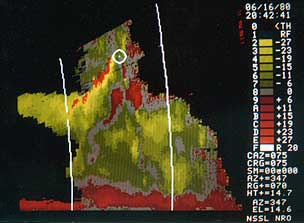
(b) The vertical cross section of the Doppler velocity field for a storm on 16 June 1980 in central Oklahoma. Range arcs are 20 km apart; left arc is at 60-km range. Evident are the boundary layer flow toward the storm and the outflow in the anvil cloud (+10 km AGL). The circular cursor marks the 14.7-km altitude. (The reflectivity in the same cross section is in Fig. 9.22.) larger image
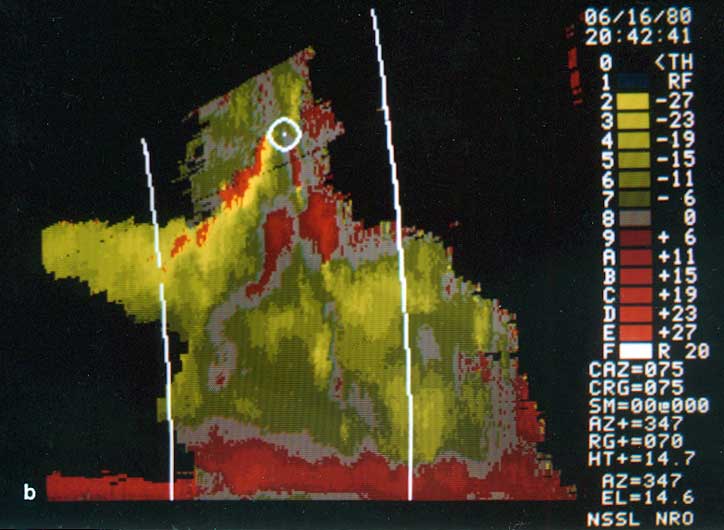
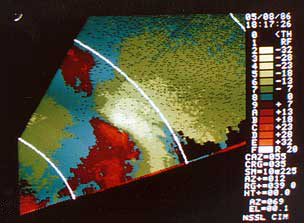
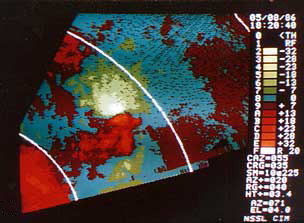
(c) A PPI display of Doppler velocities from converging flow a few hundred meters AGL in the Edmond, Okla., tornadic storm of 8 May 1986; range arcs are 20 km apart. larger image
(d) As in (c) but from an almost purely rotating flow at 2.3 km AGL in the Edmond storm's cyclone. larger image
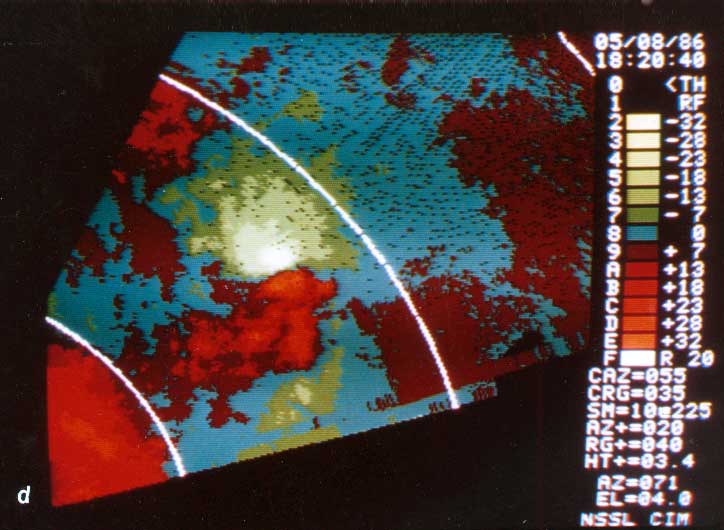
Plate 1 | Plate 2 | Plate 3 | Plate 4
« Return to NSSL Books