
| |
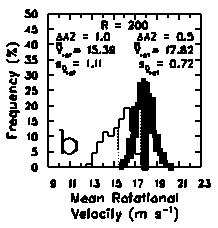
Fig. 4. Frequency distributions of mesocyclone mean rotational velocities across the bands at (a) 150 and (b) 200 km range in Fig. 2. The thin (thick) lines correspond to the 1.0o (0.5o) azimuthal data collection. The average of mean rotational velocities (Vrot with double overbars) is indicated by a vertical dotted line. The standard deviation (s) of the mean rotational velocity is also given. |