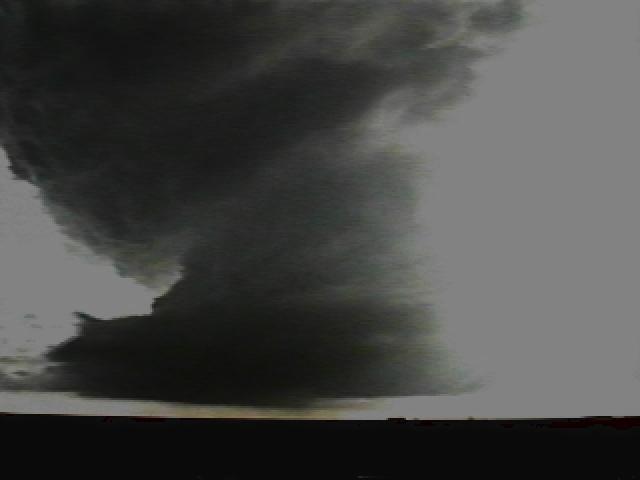
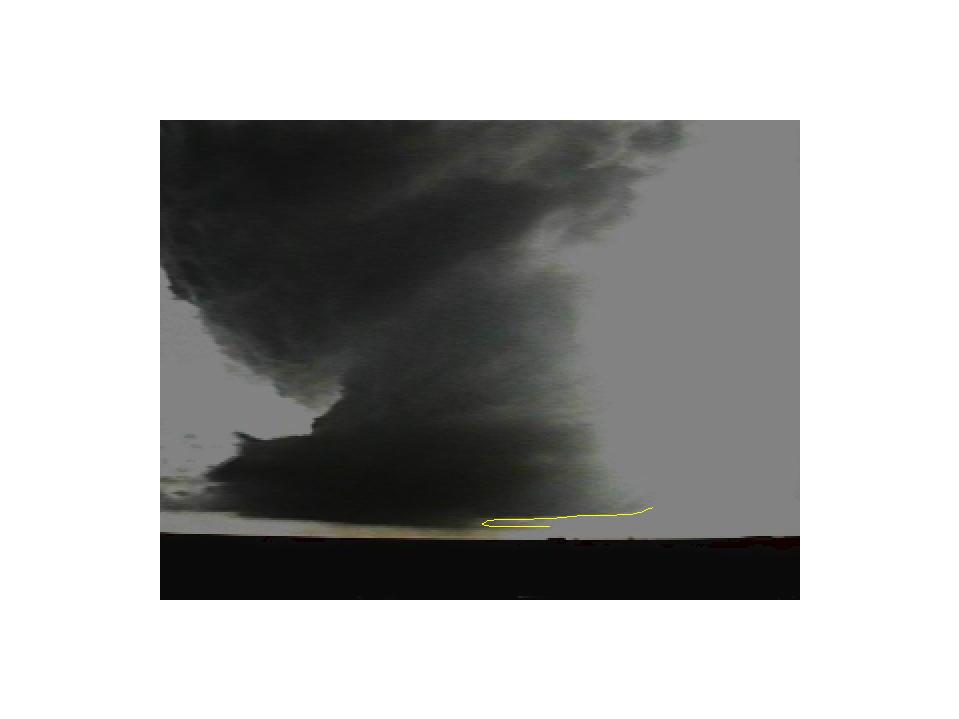
This LP or perhaps dry classic supercell had an incredible appearance both visually and on radar. The observer responsible for the pictures above observed the storm rotating strongly from cloud base to the mid-levels. About ten miles ENE of the center of the updraft base, the observer experienced easterly inflow winds estimated at about 30 knots. The storm showed every visual and radar signature of a potentially tornadic thunderstorm, including a strong rear flank downdraft (RFD), embedded withing the outbound data in the storm relative velocity data. The observer, looking southwest, witnessed a clear slot in the cloud base that can just be seen near the horizon in the picture above. The RFD plowed some dust plumes outward from the storm, and between 0020 Z and 0030 Z, a small depression formed in the cloud base north of the RFD where one might expect a wall cloud. The velocity signature was that of a weak tornado vortex signature (TVS) at both 0024 Z and 0029 Z, seen in the lower two panels of this 4-panel image. Horizontal motions at cloud base were quite strong, but it is not known for certain whether there were any brief tornadic spin-ups. Evidence suggests this storm likely did not produce a significant tornado during its lifetime. Meanwhile, the long-lived, large White Deer tornado was taking place only about 15 miles to the north (the other storm in the reflectivity image).
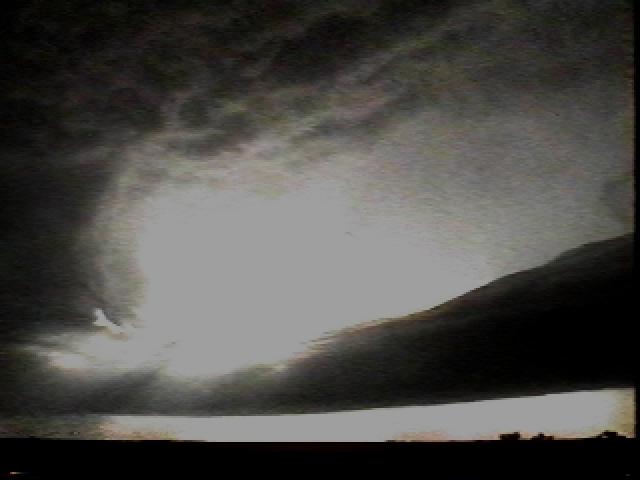
One of the very interesting features of the I-40 storm was its extensive beaver tail*, formed along the edge of the forward flank downdraft. The feature extended at least 10 miles downstream from the storm base, and can actually be seen in the velocity data. At least three large, distinct Kelvin-Helmholtz instability waves formed along the beaver tail. They were particularly dramatic examples of these waves. The reflectivity cross section was taken along the forward flank edge/beaver tail, across the updraft base, and through a bit of the hook echo. The cross section shows nicely the flow coming in at both sides of the updraft (0-20 km) and ascending, and it may slice through the beaver tail (20-29 km), although choosing the angle of the cross section is not easy. Also of note was the large "vault" region, and the associated donut hole of weak reflectivites that shows up well in the cross section (15-22 km). With strong sunlight coming in through the precipitation hole the storm was really a sight to behold.
![]()
*Discussion of the "Beaver Tail" and "Tail Cloud" from the Storm Spotter's Glossary
Other chasers' perspectives on this LP Supercell:
Bobby
Eddins
Back to NSSL
SWAT Case Study Table of Contents Page.