Unfortunately the DEM's (Digital Elevation Models) are not without flaws. This section discusses one of the problems and shows some examples. Fortunately, errors of this type are localized enough and small enough that they wouldn't have a significant impact on the discussions in this study.
The problem is easy to overlook, but careful inspection reveals fictitious edges. The data has the appearance of being digitized in smaller strips or blocks and then when it was merged together, there was a mis-match of values across some boundaries. The topography looks realistic on both sides of the boundary, but there is a discontinuity as one crosses the boundary. This discontinuity typically amounts to a few tens of meters.
The following image shows the SW quarter of the Grand Canyon Quadrangle. A horizontal edge discontinuity subtly appears in the lower middle of the image (at about the 36.1 degree latitude level).
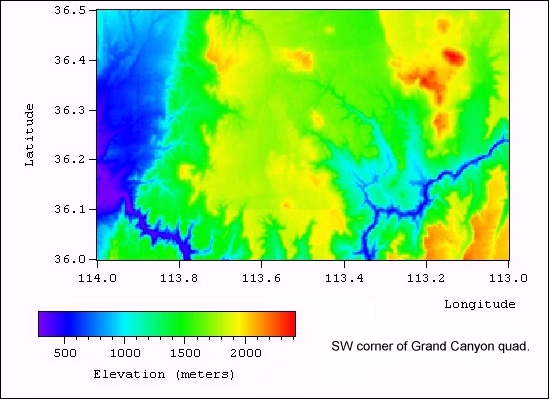
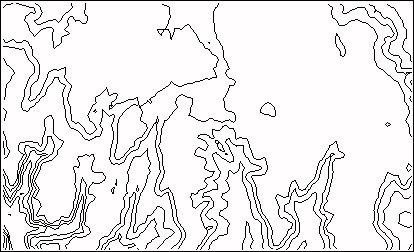
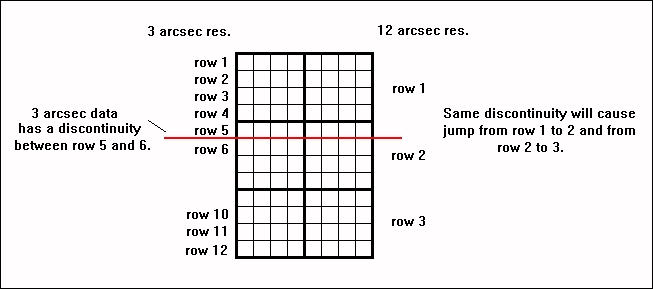
The boundary shows up clearly in the first image. The second image is a contour plot at 100 m intervals and the edge is very clear. The third image is a contour plot at 200 m intervals and the edge happens to not show up. Actually there is a section of contour in that image that runs along the discontinuity but it isn't perfectly linear so it is indistinguishable from normal terrain. The second map was generated with the full 3 arcsec resolution data. The edge is very sharp there. The first and third map were generated with the 12 arcsec resolution data. In the 12 arcsec data, the discontinuous edge gets smeared out over two steps. This can be seen in the first of the three images above. This can happen when the 3 arcsec data is averaged into the 12 arcsec data, as illustrated in the image below.
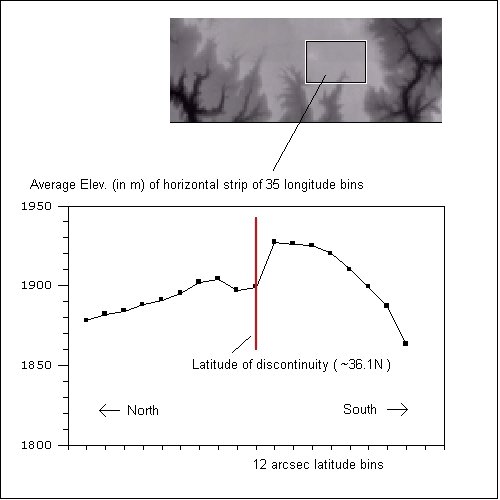
The size of the discontinuity can be assessed by looking at the actual values. The following image shows the results of such an analysis. A section of the Grand Canyon edge is chosen and the elevation values were averaged in horizontal strips. The graph shows these strip averages versus latitude. The location of the discontinuity shows up well and the jump across the edge is about 30 meters.
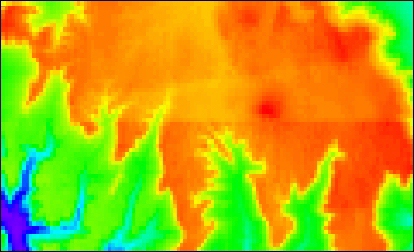
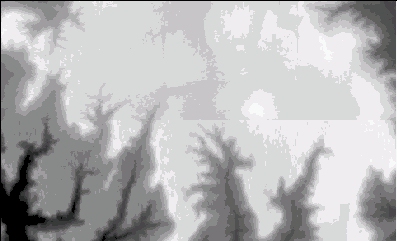
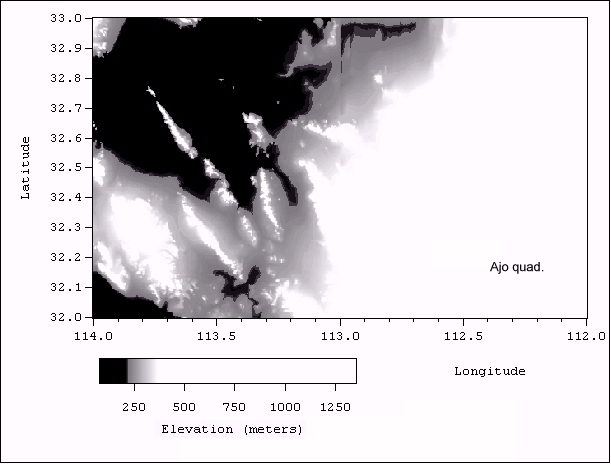
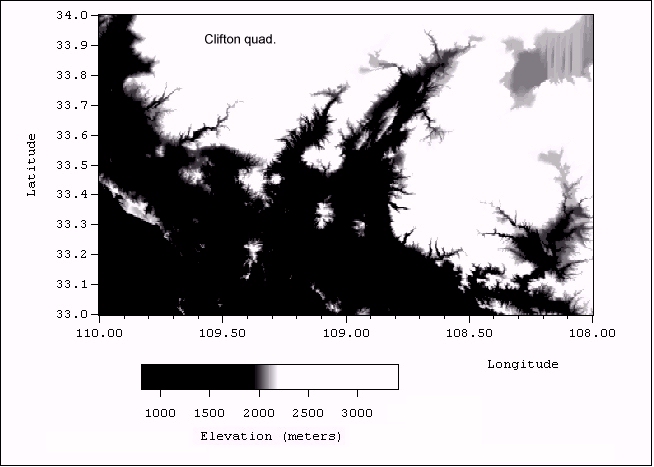
Similar edges can be seen in other quads as well. The following two images show examples in the Ajo Quad. and Clifton Quad. In both cases the odd grey scale has been arranged to provide a strong contrast right in the range of the defects. With a more normal scale, the features virtually disappear. The defects can be seen in the top center part of the Ajo Quad. and the upper right corner of the Clifton Quad.
These discontinuous boundaries have been seen in several of the DEM's.
It has been spot checked (by directly searching through the huge text files
involved) to verify that the problem exists in the original data from the
USGS and has not been introduced by later processing. The edges can be
north/south or east/west or form the corner of a rectangle. They show up
the best in flat terrain. The discontinuity is typically 20-50 m and can
change along the length of an edge.