HotSeat: How To Run a Simulation
Introduction
NOTE: The HotSeat Warning Simulator is an in-development (beta) project.
Welcome to NOAA’s HotSeat – a web-based warning operations simulator. HotSeat was created as an education and outreach tool for teachers, students, and weather enthusiasts of all ages and experience levels. Simulations are intended to give participants an appreciation of the meteorology of severe weather events and the decision-making process that go into warnings of NOAA’s National Weather Service (NWS). HotSeat uses archived Weather Surveillance Radar (WSR-88D) data, severe weather reports, and damage survey photographs from actual events in a displaced real-time (DRT) mode to approximate the feel of issuing severe weather warnings in the NWS. Upon completion of each event, the participant will receive a score indicating his/her success in a simulation. Each simulation runs approximately 20 minutes.
Use of the simulator in classroom settings can complement teachers’ weather units in science and may inspire future scientists. HotSeat can be employed to train emergency managers and other key decision-making officials, as well. Ultimately, we hope HotSeat will make its participants better users of NWS warnings.
System Requirements
HotSeat will only run on modern browsers that support HTML5 canvas animations.
- Internet Explorer 11
- MS Edge 14 and up
- Firefox 51 and up
- Chrome 49 and up
- Safari 10 and up
- Opera 43 and up
Running a Simulation
The goal of a simulation is to achieve the highest possible score by issuing quality warnings. This is done by dragging and dropping warning tiles over areas where severe weather is expected—before that weather begins in those areas, while avoiding the issuance of false alarm warnings (no event occurs in the warned area). Your scoring will be determined by the following:
- If a severe weather event occurred in your warning area (points gained).
- The warning lead time, defined as the length of time between warning issuance and when severe weather occurs in that warned area (greater points for longer lead time).
- Any false alarm warnings (points lost).
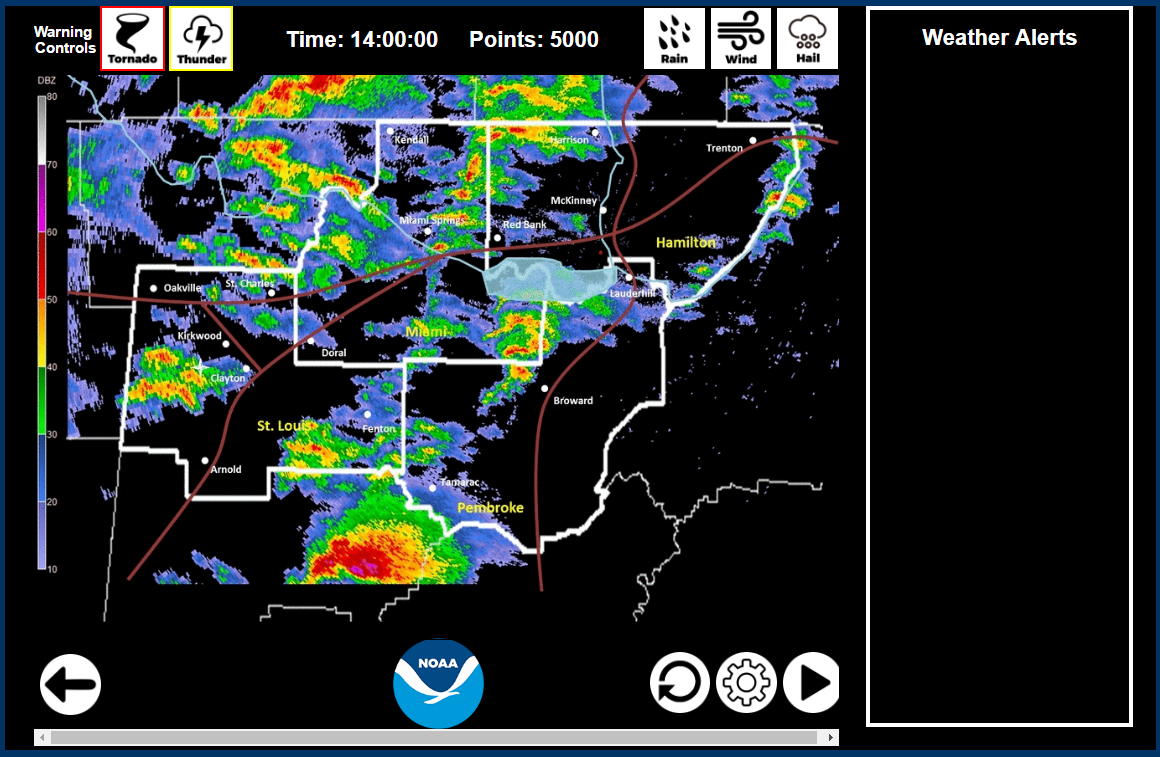
Your area of responsibility, known as the County Warning Area (CWA) in the NWS, is inside the thick white borders on the map. You will not be scored for warnings issued completely outside this area. [+]
Your area of responsibility, known as the County Warning Area (CWA) in the NWS, is inside the thick white borders on the map. You will not be scored for warnings issued completely outside this area.
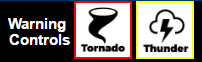
Warnings are issued using the red and yellow square tiles. [+]
Two types of warnings can be issued using the red and yellow square tiles in the upper left corner of the screen:
- Severe Thunderstorm Warnings (SVR; the yellow tile labeled “Thunder”) should be issued if damaging winds (58 mph or stronger) and/or large hail (one inch in diameter or larger) are expected.
- Tornado Warnings (TOR; the red tile labeled “Tornado”) should be issued if a tornado is possible. Please note, tornado warnings also “cover” damaging winds and large hail, so a SVR is not necessary where/when a TOR has been issued. This minimizes public confusion.
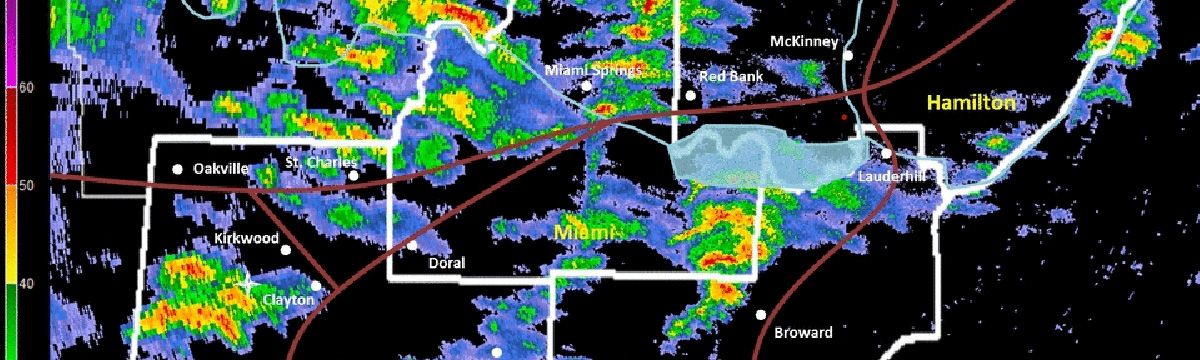
Severe weather reports are overlaid as a flashing circle on the radar. [+]
To issue a warning, “drag and drop” a tile (Tornado or Thunder) to the chosen location using the left mouse button. You may cancel a warning at any time by right-clicking on that tile.
In a simulation, archived radar data are displayed at an update frequency you choose (see below). Reports of severe weather (tornadoes, hail, wind, etc.) are overlaid as a flashing circle on the radar imagery where and when the phenomenon occurred as a simulation proceeds and corresponding details of each report show up on the list on the right side of the screen.
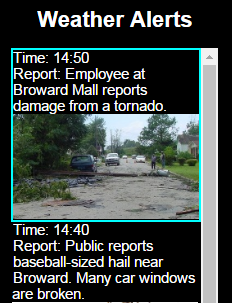
Details of severe weather reports show up on the right side of the screen. [+]
Prior to starting a simulation, set your preferred simulation speed. This is done by clicking on the gear icon in the lower right corner of the screen and setting the “Time Multiplier” to your preferred speed. The number you choose is the value by which your simulation clock is multiplies (e.g., “1” is actual speed, “2” is twice the actual speed, etc.). We recommend a “2” for a reasonable pace of a simulation.
There are three types of radar images you can view by using the icons on the upper right corner of the screen:
- “Rain” (also called reflectivity) shows where rain and hail are falling. Colors of red and purple indicate heaviest rain and possibly hail.
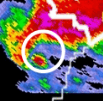
- “Wind” (also called Doppler velocities) show wind directions and speeds. Red pixels indicate wind moving away from the radar, green pixels indicate wind moving toward the radar. The brighter the color, the stronger the wind. For tornadoes, you are looking for bright red and green pixels close together (and often within a hook echo of the reflectivity or “Rain” image). The radar is located where there is a black circle on the “Wind” images. It is also evident at the boundary of the large green and red areas (which indicate the background or “ambient” winds).
- “Hail” (also called vertically integrated liquid, or VIL) shows where hail is most likely. The brighter the color, the larger the hail. Light blue is usually not hail.
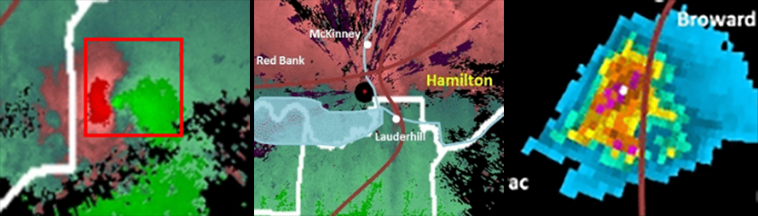
L-R: Velocity couplet, black circle indicating radar location, hail display [+]
You can toggle through these three images by pressing the up and down arrows on your keyboard. Likewise, you can step forward and back in time with the left and right arrows, respectively.
To start a simulation, click on the icon. Click the icon to pause. You may now place warning tiles where you think they are needed.
Tips for running the scenario:
- When the scenario begins, there will be no warnings in effect. Get all your warnings out as quickly as possible BEFORE worrying about the path of the storms.
- You can overlap warnings. The earliest of successful, overlapping warnings will be the one that verifies, giving you the largest possible lead time bonus.
- Once you have the initial warnings issued and reports start coming in, place warnings out in front of the storms for lead time bonus points.
- Warnings cost you points for every minute they are in effect, so be sure to cancel them (right-click) after the storm has passed. The key word here is "AFTER."
- Make sure you are looking at the most recent radar scan when you are about to issue a warning. You can step forward/backward in time using the left/right arrow keys.
- The NWS frowns upon false alarms, but when you are issuing warnings that only cover a small area, a few false alarms are inevitable and necessary. Remember, a missed event will cost you far more points than a couple false alarms.
- Just because there were no damage reports were received for a certain storm, it doesn't mean there was no damage. It could mean that no one lives in that part of your area.
- Do not waste your time issuing warnings for storms outside your County Warning Area. You will not be scored for warnings you issue completely outside your area.
Scoring
Severe Thunderstorm Warning (SVR) (issued with the “Thunder” Tile)
- Issuing a SVR costs 1000 points plus 50 points for every minute the warning is in effect
- A SVR verified by hail damage earns 5,000 points plus 10 times the number of seconds of lead time.
- A SVR verified by wind damage earns 5,000 points plus 10 times the number of seconds of lead time.
Tornado Warning (TOR) (issued with the “Tornado” tile)
- Issuing a TOR costs 2000 points plus 100 points for every minute the warning is in effect.
- A TOR verified by hail damage earns 5,000 points plus 10 times the number of seconds of lead time.
- A TOR verified by wind damage earns 5,000 points plus 10 times the number of seconds of lead time.
- A TOR verified by a tornado earns 10,000 points plus 25 times the number of seconds of lead time.
Missed Events
- Wind damage or hail where no warning was issued is a missed event and costs 2,500 points.
- A tornado where no warning was issued is a missed tornado event and costs 20,000 points.
Final Notes
HotSeat was originally developed by NOAA’s NWS Weather Forecast Office in Peachtree City, GA and then updated/enhanced by NOAA’s National Severe Storms Laboratory (NSSL). We are employing an open source approach so that anyone can submit scenarios to the NSSL developers. Contact the NSSL Outreach Specialist at NSSL.Outreach@noaa.gov to submit a scenario. New simulations will be created and added over time.
Good luck!
Are you ready? YES! Bring it on!
Please direct questions and suggestions about HotSeat to NSSL.Outreach@noaa.gov.