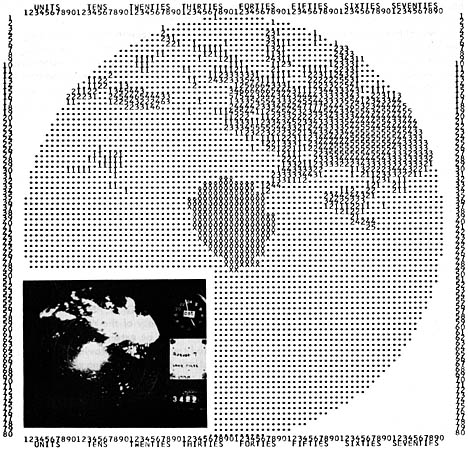
Figure 3. Digitized distribution of radar echo intensities within 100 nm. of Norman, Okla., August 7, 1963, as produced by a computer from series of WSR-57 radar observations. A photograph of the plan position indicator with high radar sensitivity is also shown.