(Revised 14 December 2005)
Comments to Harold Brooks at noaa.gov
A long-term goal of our climatology work at NSSL is to develop statistical models of severe weather threat. We'd like to be able to look at a series of questions. For tornadoes, those questions would be:
For a given location and a given time period,
We've started addressing the first question with the daily tornado probability maps. The third question is addressed in this paper. This page begins a look at the second question.
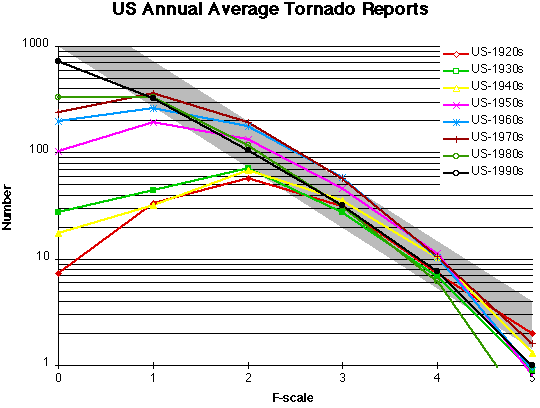
Let's start by looking at the average annual number of reports by F-scale in the official NWS record by decade.

The number of reports has increased over time, particularly at the low end of the F-scale. The 1990s have been the first decade with more F0 tornadoes reported than F1. A simple assumption about the statistical distribution of tornadoes by F-scale is that the number should decline logarithmically with increasing F-number. (This is essentially a simple model of the distribution of a rare event.) If that were perfectly true, the distributions would look like a straight line on this chart. It's pretty clear that we've started approaching that logarithmic decline in the US.
The grey region represents what might be where the "true" distribution of tornadoes lies. We're likely to underreport weak tornadoes because they aren't seen and underreport violent tornadoes because structures weren't hit. As a result, we would expect the reports to be curved a little above the log-linear decline. The log-linear decline would estimate, in F-scale class N, that there are about 27% of the tornadoes in F-scale class N-1. That is, I'd expect the number of F1 tornadoes to be 27% of the number of F0 tornadoes.
The grey area also implies that there are probably 1600-2200 tornadoes per year in the United States.
The probability of having a particular F-scale tornado, given that a tornado occurs, is different in different parts of the US, as shown below:
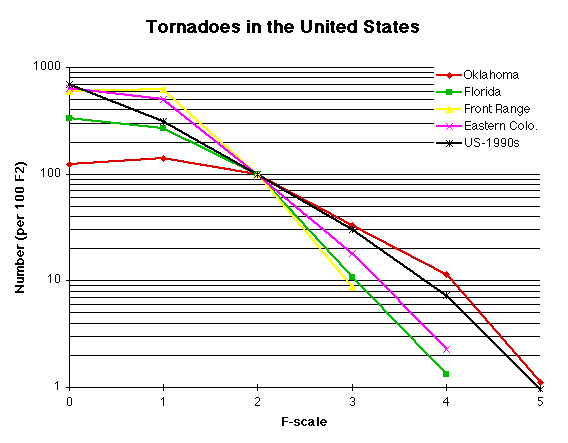
This is based on the 1950-1995 data (as recorded state-by-state at The Tornado Project.) I've normalized things by 100 F2 tornadoes. (The choice of this normalization can make some aspects of the interpretation tricky, but I'll try not to push things too far.) I want to concentrate on the slope of the lines, particularly above F1. A working hypothesis that Chuck Doswell and I (and others) have is that there are a number of basic processes that lead to the development of tornadoes from convective storms. For simplicity, let's consider two possible processes: one that involves a deep, persistent mesocylone (supercell tornadoes), and a second process that doesn't (non-supercell tornadoes). From those two processes, we expect that the probability of a violent tornado occurring, given that a tornado does occur, is higher for the supercell case than for the non-supercell case. If that's true, the distribution would be more nearly horizontal for supercells than for non-supercells. Here, we can see that the slope is much flatter for tornadoes in Oklahoma, where the supercell mechanism likely dominates, than for the Front Range of Colorado, where non-supercells dominate. (The Front Range counties, as defined here, are: Arapahoe, Boulder, Denver, Douglas, Jefferson, and Weld.) The Front Range is similar to Florida where, again, we might expect non-supercell tornadoes to be more common. The eastern part of Colorado (Baca, Bent, Cheyenne, Elbert, Kiowa, Kit Carson, Lincoln, Logan, Phillips, Prowers, Sedgwick, Washington, and Yuma Counties) is in between the Oklahoma and Front Range slopes.
The United States (1990s) slope results from being the mixture of the different processes.
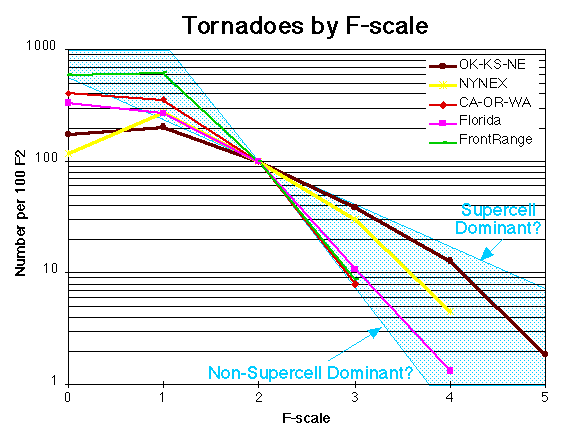
We can take a look at those processes by considering some other areas as well. The graph below shows some states lumped together to increase the sample size. Note that the NYNEX area's slope is reasonably close to OK-KS-NE. (I don't show it below, but the slope of other regions, such as Pennsylvania, Ohio, Indiana, Michigan, Illinois, Wisconsin, Minnesota, and Iowa, and Missouri, Arkansas, Kentucky, and Tennessee are also similar.) At the other extreme, California, Oregon, and Washington look a lot like Florida and the Front Range. It's possible that those slopes represent regimes in which the supercell and non-supercell processes dominate. The two slopes are associated with ratios of F(n+1)/F(n) of .42 for the "supercell dominant" process and .07 for the "non-supercell dominant" process. Note that these are the slopes for "pure" processes and that the observed slope of .27 above could be the result of mixing the two.
I've managed to put together a number of tornado climatologies from around the world and hope to add more as time goes on. It is interesting to compare the tornado ratings from various countries. (As with the last picture, these have been normalized to 100 F2 tornadoes, so that we can look at the slopes.)
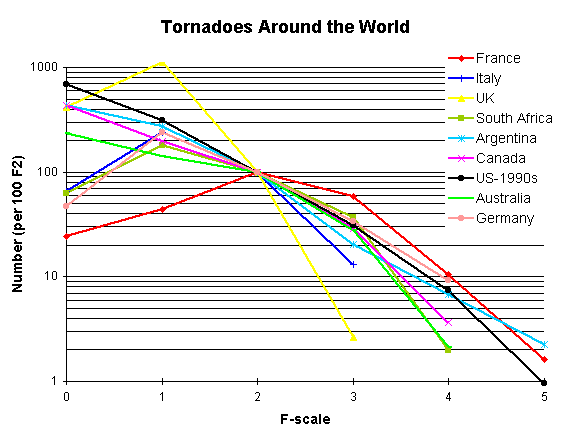
Slopes for everywhere except the UK are in the same ballpark, particularly if the French record is limited to F3 and above. If the French record underreports F2 and lesser tornadoes (as I expect it does as shown below), the slope would work out very well. The UK record has a slightly steeper slope than the non-supercell dominated process above, but that could be a sampling issue.
I'm especially impressed by the Argentinian record, compiled by Maria Luisa Altinger de Schwarzkopf. The slope implies, to me at least, that it's a pretty complete record or that the record is being sampled well.
The UK slope is very different from the rest, resembling the Front Range/Florida slopes above.
Sources:
Argentina: Altinger de Schwarzkopf, M. L., and L. C. Rosso, 1982: Severe storms and tornadoes in Argentina. Preprints, 12th Conf. Severe Local Storms (San Antonio, Texas), Amer. Meteor. Soc., 59-62. [Record covers 1930-1979]
France: Francois Paul (personal communication). [Record covers 1680-1999] (See Paul, F., 1999: An inventory of tornadoes in France. Weather, 54, 217-219.
Ontario: Mike Leduc (personal communication). [Record covers 1944-1999] (What Mike gave me has F0-F1 combined together. I've made a partition of 70% F0, 30% F1.)
South Africa: Goliger, A. M., R. V. Milford, B. F. Adam, and M. Edwards, 1997: Inkanyamba: Tornadoes in South Africa. CSIR Building Technology and South African Weather Bureau. 77 pp. [Record covers 1905-1995]
UK: Meaden, G. T., and D. M. Elsom, 1982: Tornadoes in the United Kingdom. Preprints, 12th Conf. Severe Local Storms (San Antonio, Texas), Amer. Meteor. Soc., 55-58. [Record covers 1961-1980]
US-1990s: Joe Schaefer, NWS Storm Prediction Center [Record covers 1990-1998]
Tornadoes probably are underreported everywhere. In the US, we can make an estimate of how bad the problem was in the past by looking at the changes in the shape of the distribution from the 1920s to the 1990s. As a first approximation, if we assume the F3-F5 reports are reasonably complete, we can estimate how many F0-F2s there would have been reported with modern reporting systems by extrapolating back from the F3-F5 reports back to F0-F2. That's how the grey areas were drawn. It indicates that roughly 15% of tornadoes were reported in 1920-1949.
For a comparison, let's look at the reports from France (1680-1999) and compare them to the 1920s, 1930s, and 1940s, in the US.
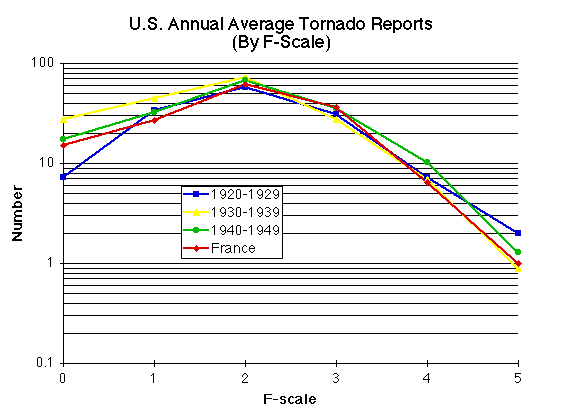
These are the raw distributions with the numbers in France divided by 2 for easier comparison. The curves are remarkably similar. From this, a crude estimate of the underreporting in France is that about 15% of tornadoes that occur are reported, as was the case before the National Severe Storms Project was begun in the US in the early 1950s. With roughly 3 reports per year (Paul 1999), that would indicate that 20 tornadoes occur on average each year in France.