Long
Range Indicators of Severe Weather:
Dry Soil Anomalies with Downwind Severe WEather Outbreaks
Lindsay
Tardif
NOAA Hollings Scholarship Program and National Severe
Storms
Laboratory
Plymouth State University, Plymouth, NH
______________________________________________________________________________________________________________________________________________________________
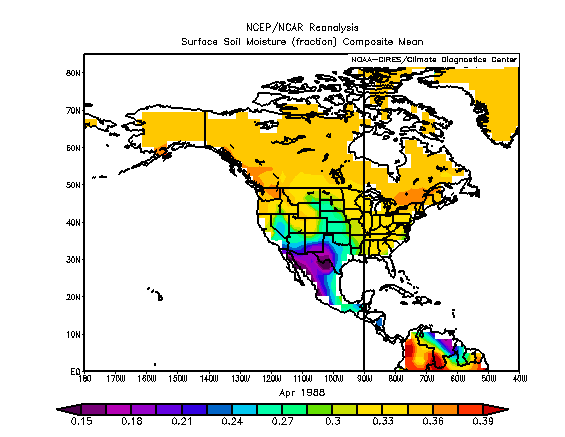
Data for the Soil
Moisture
anomalies and monthly means were collected from the Climate
Diagnostics Center (CDC).
Backward Trajectories from the region of severe weather outbreaks
were obtained from the NOAA HYSPLIT Model (NOAA
Air Resources Laboratory). Soundings for the severe tornado
outbreaks were collected from the Plymouth State Weather Center
Archive (PSU Vortex).
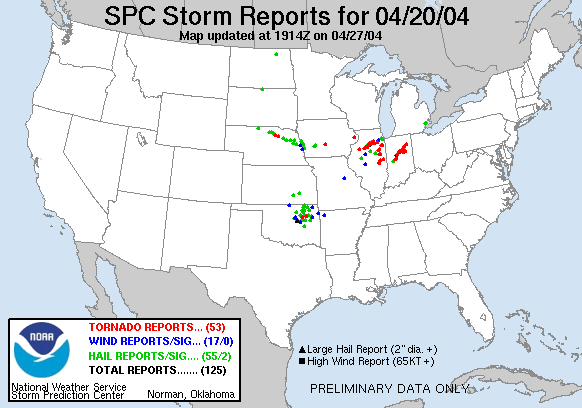
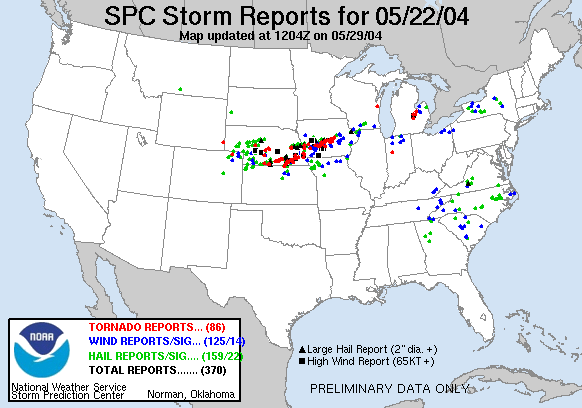
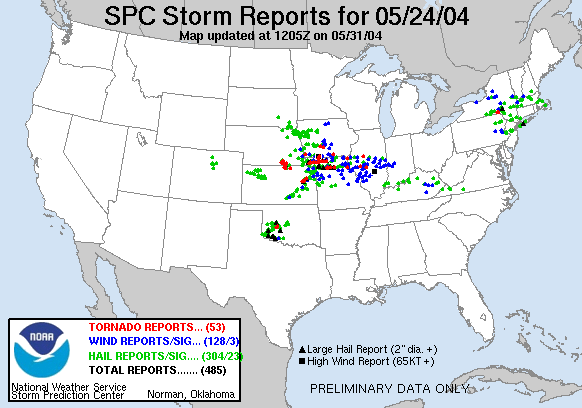
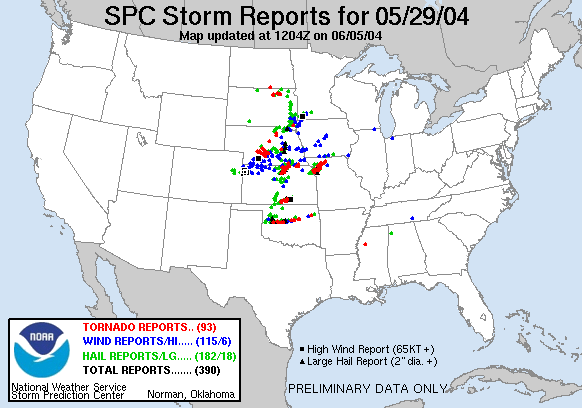
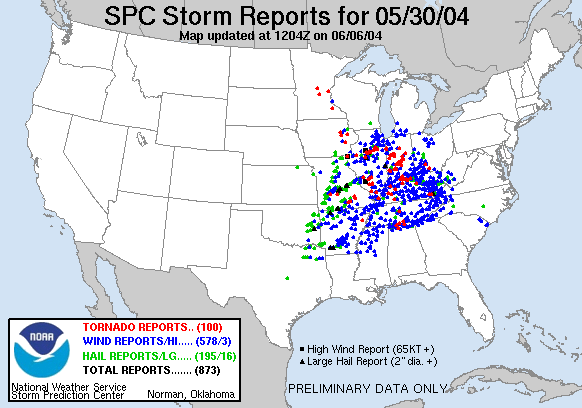
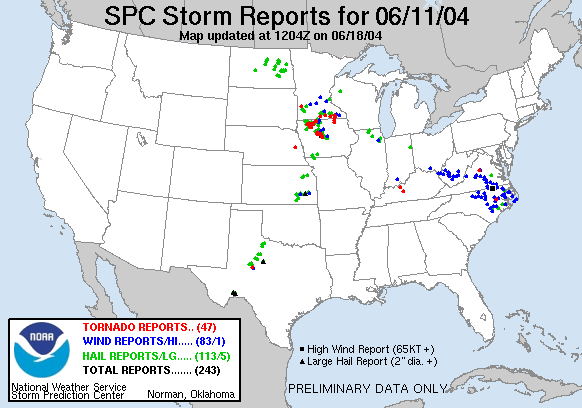
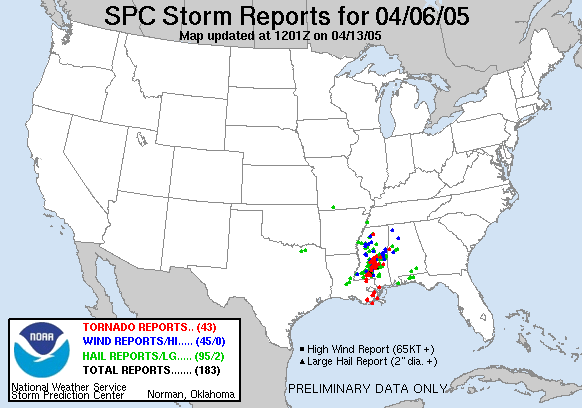
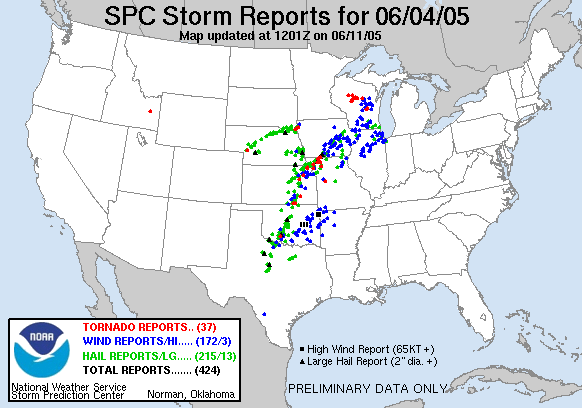
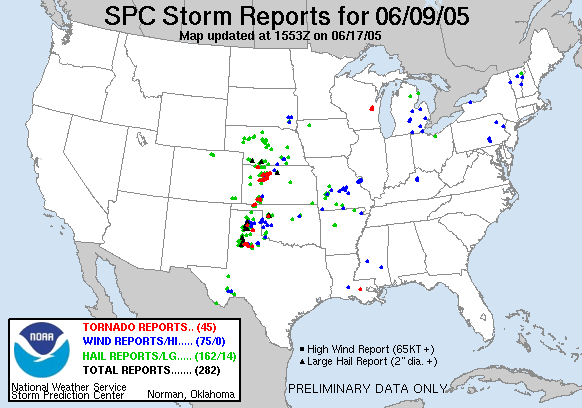
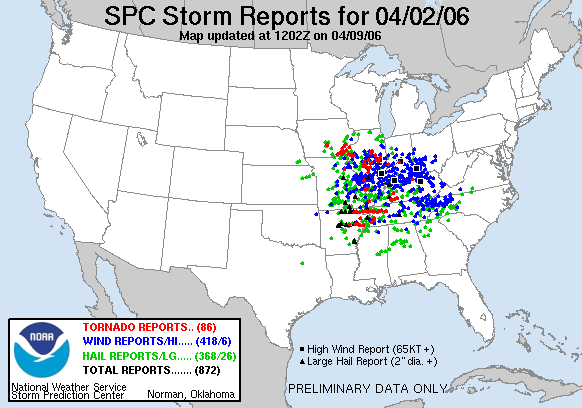
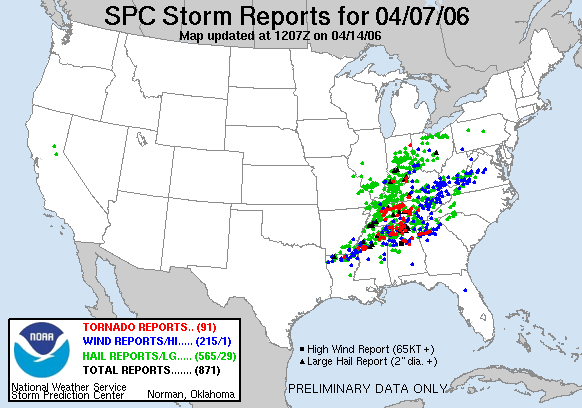
Tornado and Storm Report data was collected from both the SPC Severe
Weather Archive (SPC)
and the NSSL/SPC Severe Thunderstorm Events website (Severe
Tstm. Events).
Disclaimer: This
is an on going study. Results are still preliminary and continuous
and may not be accurate. The images, data and conclusions were
created in a research environment and are not
operational.
_____________________________________________________________________________________________________________________________________________________________________________________
The
following tables provides the data needed to analyze soil moisture
anomalies and monthly means to the environmental soundings and
trajectory data for the specific significant severe weather
outbreaks. Significant severe tornado events were classified as an
severe weather event that had 35 or more tornado reports and a number
of storm reports for the years. Tornado and Storm report data was
taken for the months of April, May and June for the time period of
1985 to the present (not including May, June and July 2006
data).
______________________________________________________________________________________________________________________________________________________________
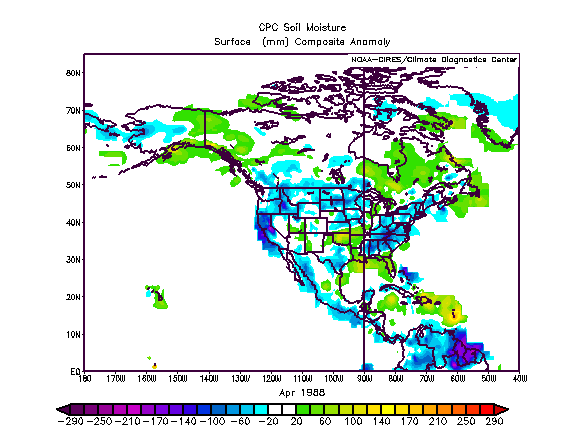
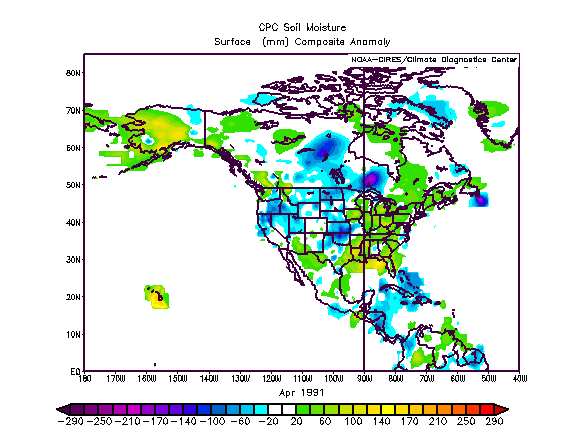
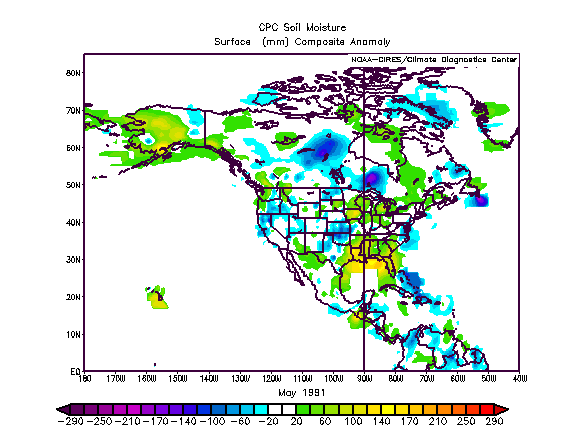
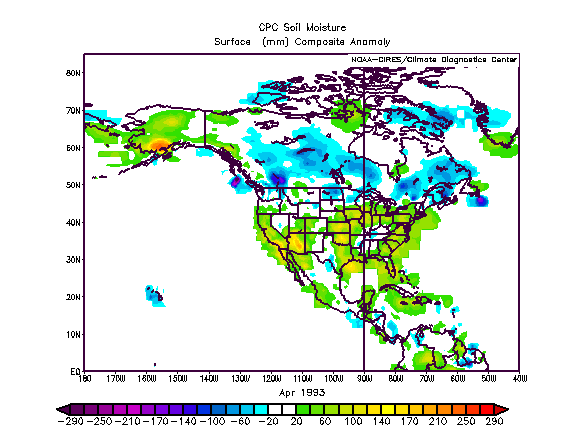
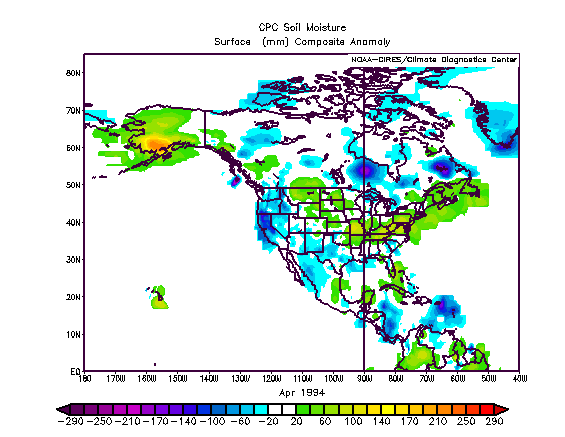
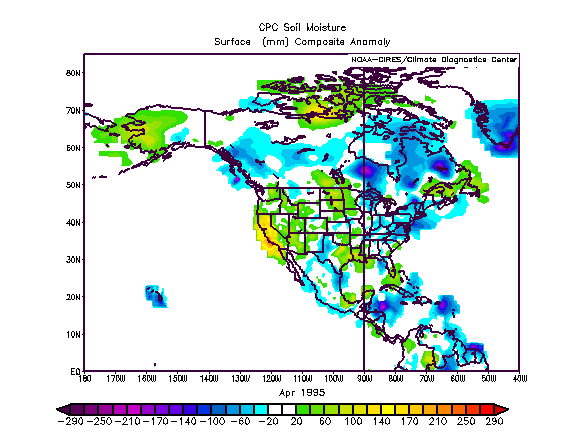
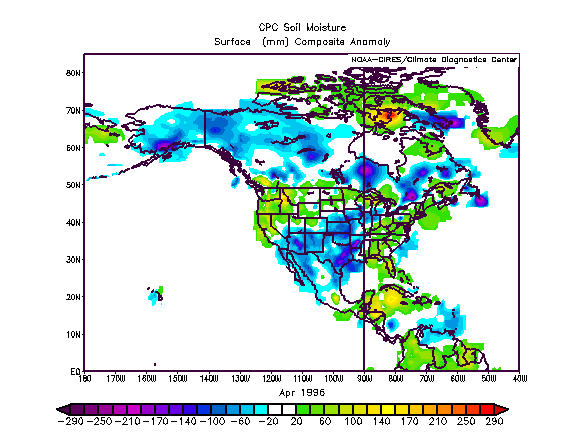
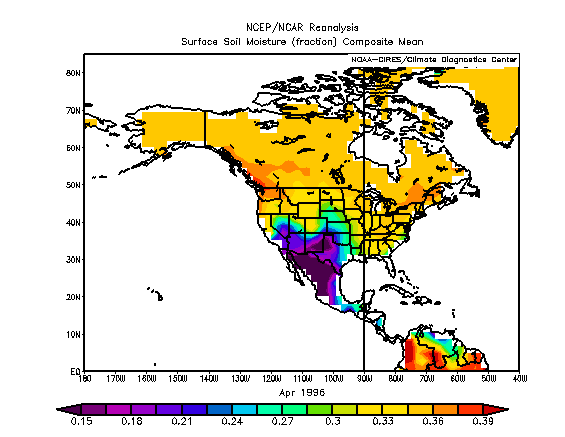
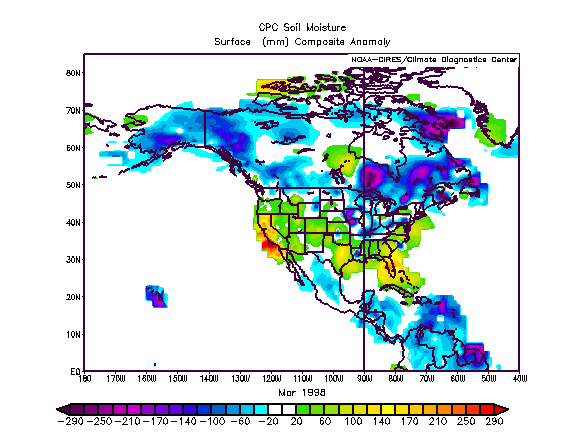
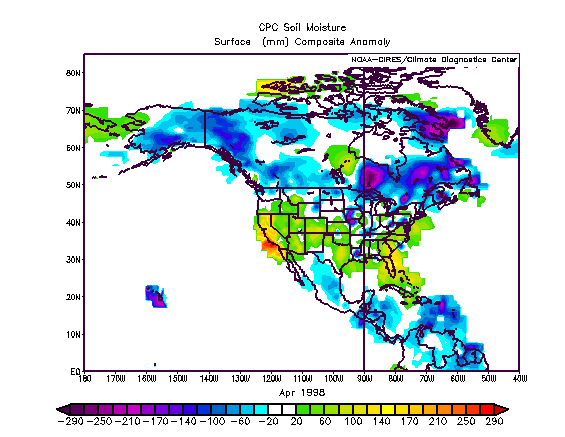
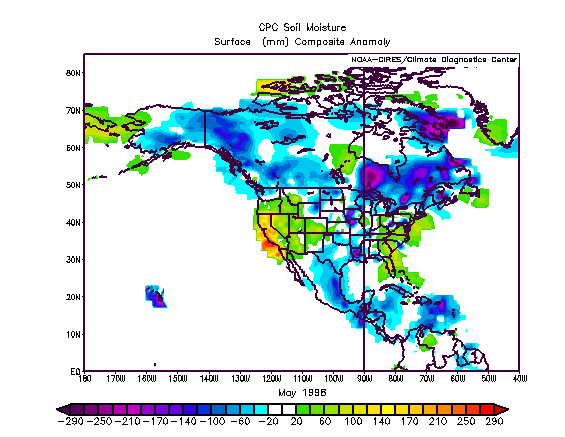
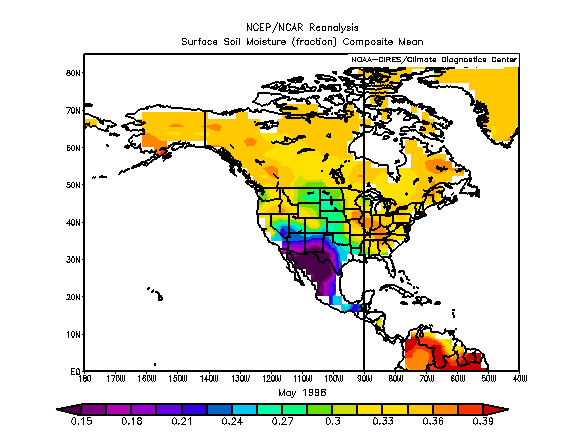
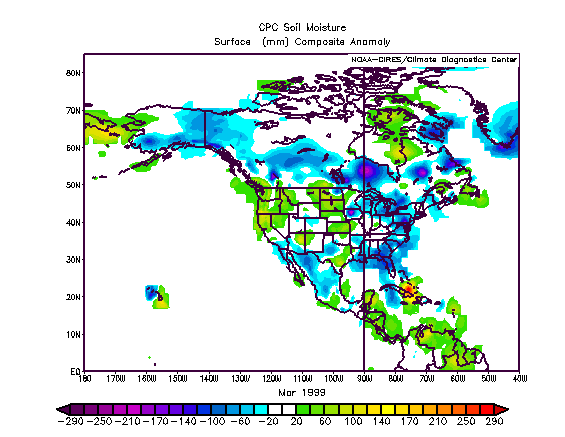
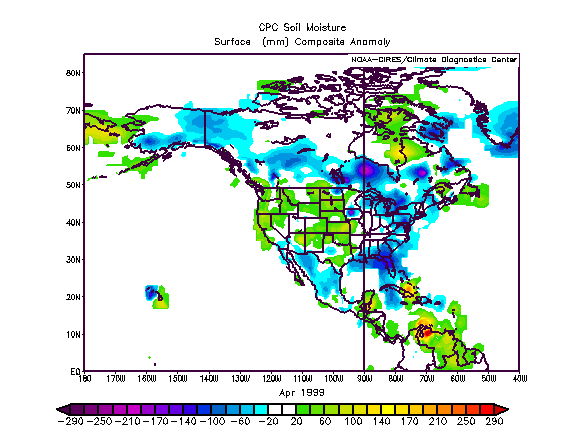
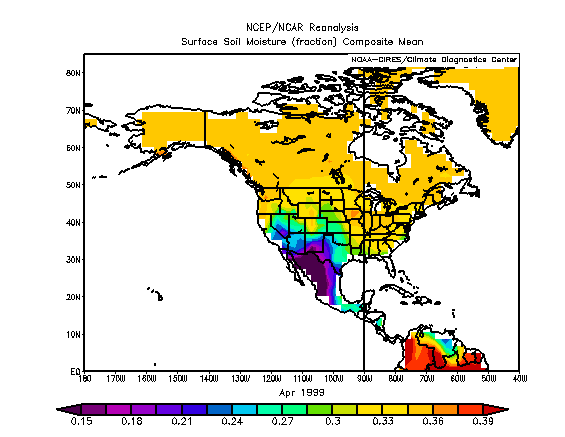
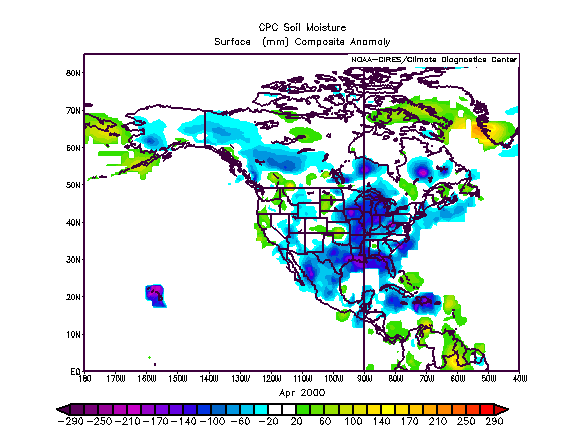
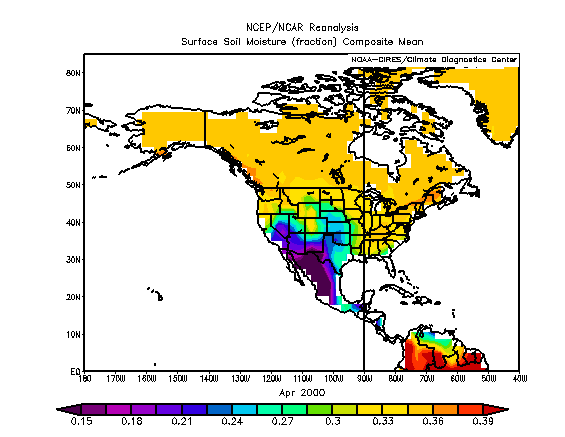
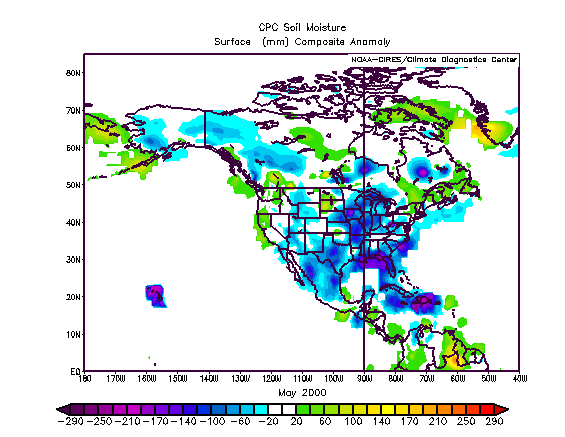
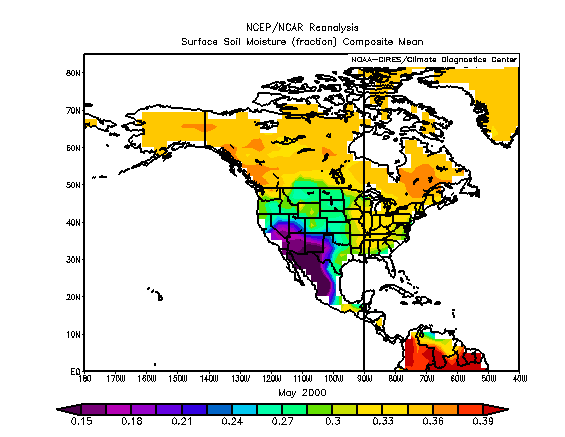
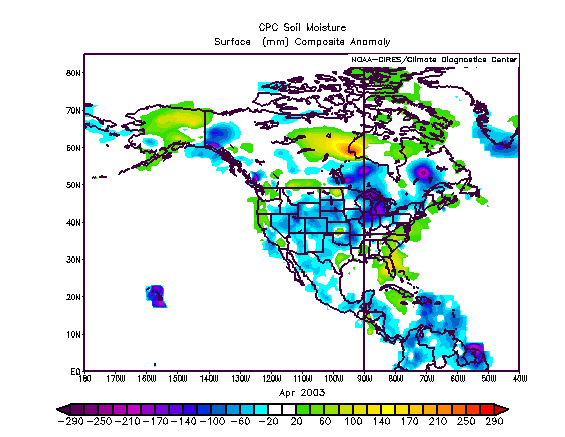
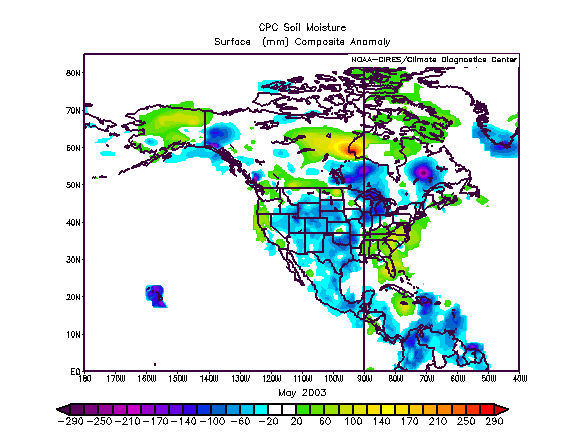
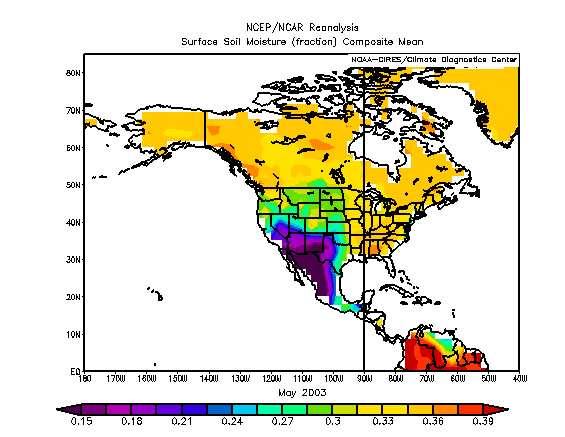
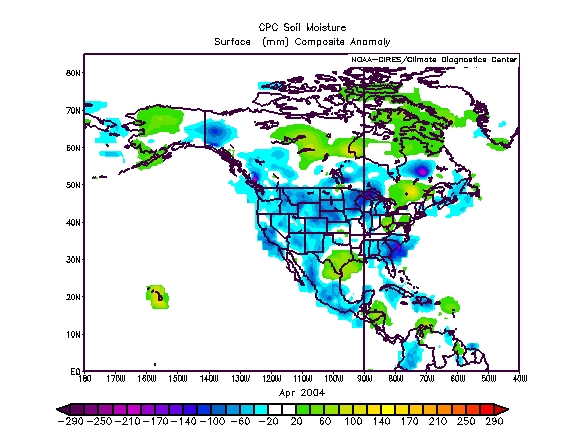
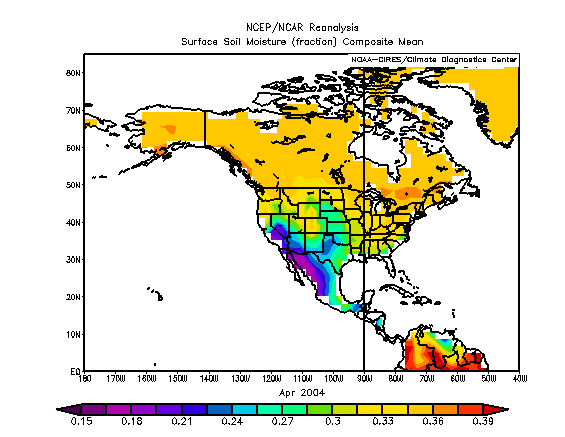
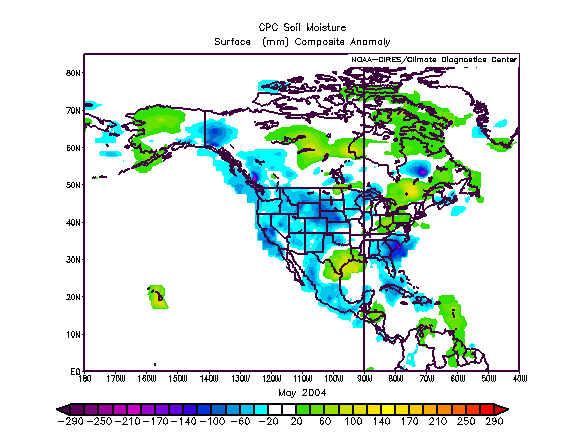
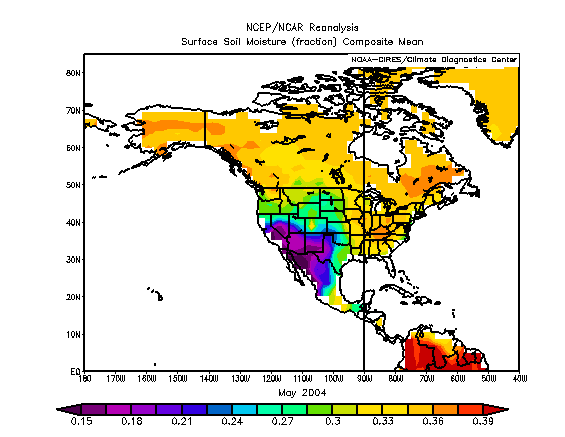
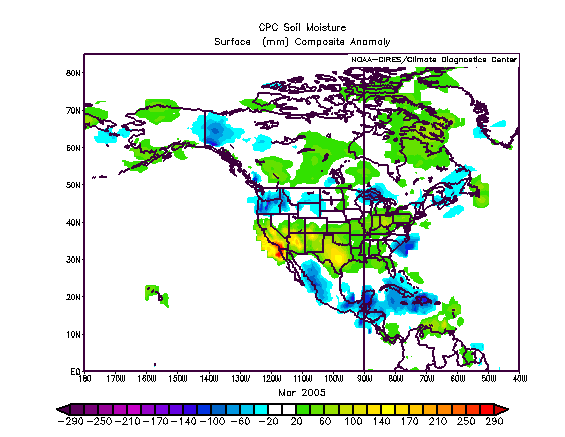
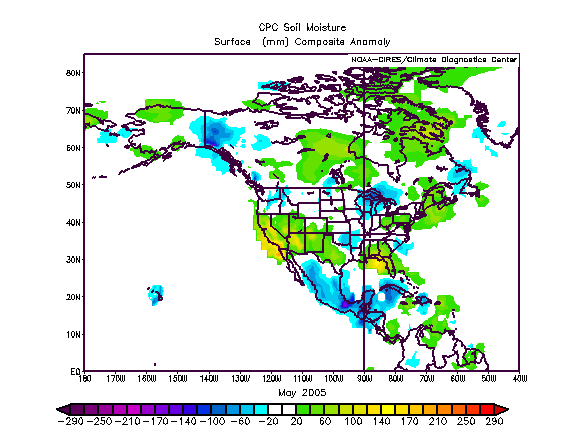
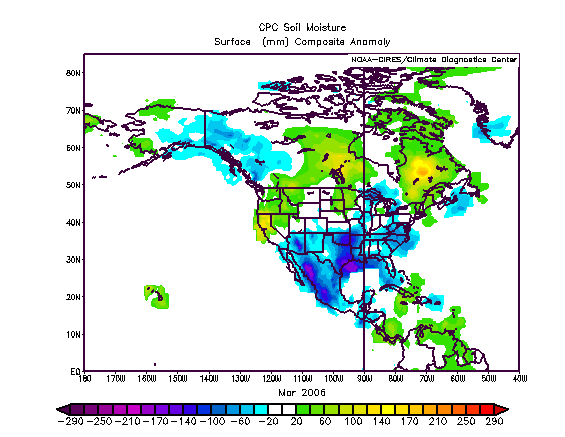
*Soil
Moisture Image links that end with the letter "a" are the
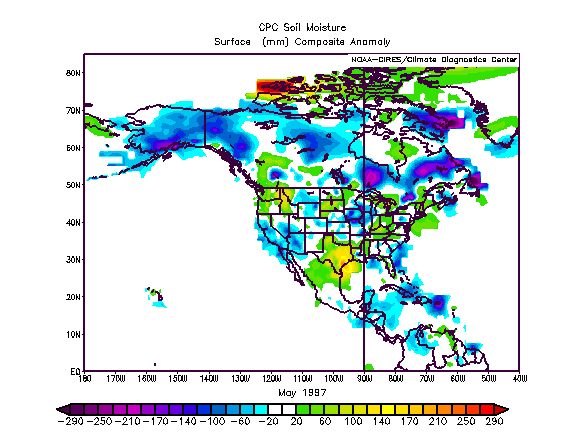
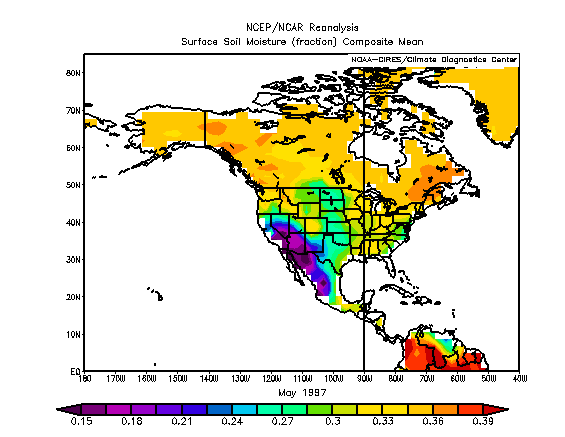
CPC Soil Moisture Anomaly for that month. Soil Moisture image
links that end with the letter "b" are the Soil Moisture
Monthly Mean for that month.*
*The images for 700mb to 500mb lapse
were not available for the dates prior to
May 8 2003. This column includes a image of total reports (link
A) and the images for the 700mb to 500mb lapse rates (link B).*
____________________________________________________________________________________________________________________________________________________________
Observations:
1.)
CPC Soil moisture anomalies with respect to trajectories:
*Significant severe weather events take place in a region where there
a slight to moderate negative soil moisture anomalies.
* The source region for upper-level air masses originate in areas
where there are slight to moderate negative soil anomalies.
* The source region for surface or lower-level air masses originate
in areas that have neutral to slight positive soil anomalies.
* The trajectory images show that the air masses or the flow sink in
the region where there are slight to moderate negative soil
anomalies.
* The trajectory images also show
that the air masses or flow rises the event region prior to the
severe weather event.
2.) Soil moisture monthly means with
respect to trajectories:
* The upper and
mid-level air masses and flow originate in regions where there are
low monthly means.
* The surface or low-level
air masses and flow originate to the south of the severe weather
event. The region of origin has moderate monthly means.
3.)
Soundings:
*soundings from the source regions
designated from the backward trajectories have the following
characteristics:
1.) Surface flow
source regions have either a moist profile with no steep lapse
rates.
2.) Upper-level flow
source
regions have dry atmospheric characteristics with gradual lapse rate
beginning at the surface.
3.)
Source regions also have a surface moist profile with an elevated dry
layer.
*event soundings had the following
characteristics:
1.) The event soundings
collected were for stations in the vicinity of the significant
tornado outbreak, therefore the soundings are not fully
representative of the atmospheric
characteristics prior
to the initial
convection. If soundings were available for the exact location for
the event, then the soundings collected would be more easily analyzed
for possible conclusions.
2.) For the soundings
that were representative of the event,
showed that there were steep 700mb to 500 mb lapse rates for the
stronger significant tornado event.
4.)
700mb-500mb Lapse Rates and CPC Soil Moisture Anomalies:
*Strong severe weather events with a large number of tornado reports
had steep lapse rates over regions of below normal soil moisture
anomalies.
* An event with fewer tornadoes
reported had a large region of steep lapse rates over below normal
soil moisture anomalies, but also had areas of steep lapse rates in
regions of moderate above normal
soil moisture anomalies. Couple of these weaker events had
steep lapse rates in areas of moderate above normal soil moisture
anomaly values, but not positioned in regions of below
normal soil moisture anomaly values.
*Steep lapse rates occurred
in the coastal region of Texas where there was a region of moderate
above normal soil moisture values.
5.) Position of significant
tornado events in respect to the position of the 700mb to 500mb lapse
rates:
* The large significant tornado
events
occurred on the leading edge of the steep lapse rates (7.5°C/ km
+).
* The small scale significant tornado
events occurred in regions where there were not as steep lapse rates
(6 to 6.5°C/ km).
* Most of the cases
showed that the steep lapse rates were positioned to the west and to
the south of the event region.
* The source
regions were inclusive to the position of region with respect
lapse rates. Paths of the Upper-level and low-level flows varied with
respect to the position of the lapse rates.