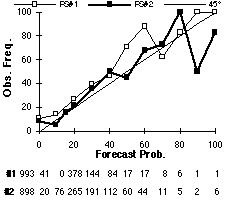
Fig. 1: Reliability diagram for FS#1 and FS#2 PoP forecasts for all five days. A 45š line showing perfect reliability is included. The numbers below the diagram show how frequently each forecast category was used (PoP=0, 10, 15, 20, 30, 40, 50, 60, 70, 80, 90, 100).
Back to text