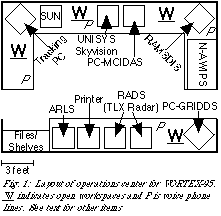
 Fig. 1).
1. INTRODUCTION[ ]
Operational support of the activities during the 1995 field phase of the Verification of the Origin of Rotation in Tornadoes EXperiment (VORTEX-95) (Rasmussen et al. 1994) was carried out from the National Severe Storms Laboratory (NSSL) in Norman, Oklahoma. The Norman Operations Center (NOC) was charged with forecasting, nowcasting, and assisting in the collection of data. During operations, the NOC acted as a "conduit" between the field coordinator (FC) and observations. Information necessary for field operations was filtered in the NOC and sent to the FC and observations from field teams came back to the NOC from the FC. [Communication and coordination in the field is discussed in Kanak et al. (1996).] In cases where that information was useful for warning purposes, it was then passed along to appropriate National Weather Service Forecast Offices (NWSFO). We will review the set-up of the Operations Center, its actions on a particular day, and the kinds of data that have been archived for analysis.
2. PREPARATION
Plans for the NOC began several months prior to the start of the field
experiment. Since real-time operational forecasting was not routinely done at
NSSL, first order and contingency plans had to be made to ensure reliable
access to data and communications links, availability of various data display
systems, and adequate workspace for data analysis and weather discussion
between forecasters, VORTEX FC, and VORTEX support scientists. The planning
for the NOC required intensive coordination between NSSL scientific and
technical support staff for the physical design of the center. Coordination
with other agencies was needed to procure additional equipment for data ingest,
display, and evaluation months prior to the start of operations The final
design of the NOC was allowed forecasters easy access to relevant data and
workspace within a fairly small area (Fig. 1).
The NOC had three primary functions. First, during morning, it served as a forecast center to highlight areas of potential severe convection during the next 12-48 hours. In 1995, text products were prepared using the forms capabilities of World Wide Web (WWW) browsers. The forecasts and weather summaries are archived at
<URL:http://antietam.nssl.uoknor.edu/mosaic_files/vortfore/archive.html>
Second, during field operation, continuous nowcasting and coordination of mobile ballooning were conducted and. Third, it supported primary communication between the FC and forecasters as well as back-up communications for all field units.
Primary data display was provided through an N-AWIPS workstation. VORTEX forecasters were able to collaborate with scientists and programmers from the Storm Prediction Center (SPC) to develop custom made graphical displays on N-AWIPS. Several interactive programs were written to enable display of integrated data sets.
Although N-AWIPS supported satellite data, the primary system for satellite display was RAMSDIS. RAMSDIS allowed a full suite of GOES-7 and GOES-8 digital and derived products to be displayed, manipulated, and evaluated. Satellite data was also available on a PC-MCIDAS system located in the NOC. This system was also used to compute real time derived convective fields (eg. CAPE, CIN, LI, etc.) using model forecast soundings and observed surface data. Hard copy charts enabled real time mesoscale analysis in the operations center. This system served as back-up to the AFOS emulator for NWS text products including raw surface observations.
WSR-88D data was accessed and displayed using the UNISYS Skyvision system. Since only a limited suite of radar products were needed in the NOC, NIDS data was sufficient for operations. Skyvision enabled
forecasters and nowcasters to evaluate radar fields using high resolution base maps, looping functions, and accessability to multiple radars and products simultaneously. A product list was created and could be modified by VORTEX nowcasters in real-time. Data were retrieved from a central site via high speed modem and could be accessed periodically or on a one-time request basis. A dual monitor workstation, connected to the Oklahoma City WSR-88D (KTLX), displayed output from the NSSL RADS system which incorporated newly developed severe weather algorithms. The system also allowed overlay of lightning strike data on various radar displays. This workstation was staffed by an NSSL scientist during operations.
A Sun workstation with access to the Internet was placed in the operations center primarily as a back-up to other systems. Besides being used for preparing the daily forecast discussion using the WWW, it provided access to WSR-88D radar products from on-line NIDS providers and the University of Oklahoma in the event that other systems failed. The workstation also gave access to real-time observational and gridded model data.
Since many of the forecasters at NWSFOs who participated in the experiment were not familiar to workstations, a 486-PC ran PCGRIDDS software for evaluating gridded operational NWP data, SHARP software for sounding analysis, enabled hard copy printouts of Oklahoma mesonet data, provided access and display to real time sounding data from the field, and additional network and internet access as back-up to other systems. This PC was also used to prepare transfer the daily forecast discussion to AFOS for distribution to regional NWS offices. In order to alert forecasters and nowcasters of the issuance of severe weather watches and warnings, another 486-PC ran the ARLS (Automated Report Logging System) software developed by John Hart at the National Severe Storms Forecast Center (NSSFC). This software produced an audible tone and printed a hard copy of all watches or warnings in the VORTEX domain as they were issued.
All computers were hooked up to laser printers which enabled hard copy to be created as needed. All charts, plots, and forecasts were placed in a daily folder and archived at the end of the shift. A forecaster/ nowcaster duty checklist was provided to each shift to maintain consistency in the data archived in the daily folder. In addition, forecast preparation forms, blank and high resolution road maps, and daily verification forms were provided for general use.
Although there were numerous back-ups to much of the data needed by forecasters, this resulted in visitors having to become familiar with numerous different computing systems and workstations in rather short time. To alleviate some of this difficulty, individual reference binders were placed beside each computer describing the primary functions of that system, specific instructions of how to operate the equipment, and a primary point of contact for questions not answered by the reference binder. A NOC read file was available. New and important information was placed in this binder daily and forecasters reviewed this binder before coming on shift. Although a shift log was not used, a dry board was placed in the operations center to alert up-coming shifts of current problems affecting operational systems as well as the status of field operations.
Phone lines provided the primary means of communication into and out of the operations center. One line was used to provide a daily status message in the morning and to coordinate sounding teams during operations. A second was linked to a PC which ran satellite messaging and tracking software to and from the FC and some sounding teams. Other lines were available for direct communication into the FC vehicle or with field teams having critical information needs..
Flexibility was critical in making this operations center a functional facility. It was important to allocate adequate workspace for each member of the forecast/ nowcast team. There were four work areas in the operations center which were designated to a particular function on each shift. The forecaster/nowcaster schedule for the entire project was prepared before the project to allow for adequate long term planning and participation in other phases of the experiment.
3. OPERATIONS SUPPORT-8 JUNE 1995 CASE
The final day of VORTEX-95 field operations was 8 June 1995. It illustrates
the work of the NOC. Briefly, a dryline was forecast to form in the Texas
Panhandle while a cold front approached the Oklahoma from the north. The
dryline/front triple point was expected to be a focus for convection, with
convection initiating further south along the dryline as the afternoon
progressed. Graphical depiction of the probability of lightning showed the
highest probability of thunderstorms over southern Kansas, northern Oklahoma,
and the Texas Panhandle (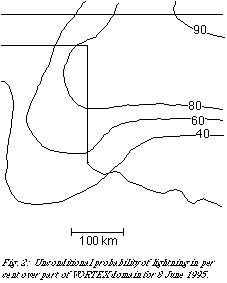 Fig. 2). Combined with a map of the conditional
probability of a tornado given thunderstorms (
Fig. 2). Combined with a map of the conditional
probability of a tornado given thunderstorms (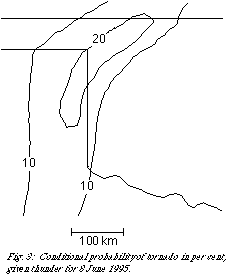 Fig. 3), the forecast target of
the most likely area for tornadoes included extreme southern Kansas,
northwestern Oklahoma, and the eastern part of the Texas Panhandle. Storms
were forecast to move from 250° at 10 m s-1 during their
supercell stage. (Observed motions at that stage were between 240° and
250° between 7.5 and 10 m s-1).
Fig. 3), the forecast target of
the most likely area for tornadoes included extreme southern Kansas,
northwestern Oklahoma, and the eastern part of the Texas Panhandle. Storms
were forecast to move from 250° at 10 m s-1 during their
supercell stage. (Observed motions at that stage were between 240° and
250° between 7.5 and 10 m s-1).
The field armada left Norman before 11 AM (local time) targeting the eastern
end of the Oklahoma Panhandle and northeastern Texas Panhandle. By
approximately 2 PM the first storm formed near the triple point in the extreme
northern Texas Panhandle. VORTEX teams intercepted the storm around 3 PM near
Elmwood, Oklahoma (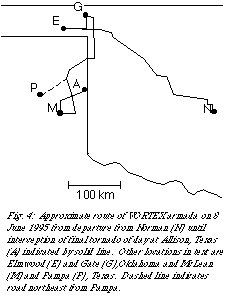 Fig. 4). Teams gathered data on the storm for about an hour
and a half as it moved northeastward towards Gate. At that time, the field
teams determined that, despite being a strong supercell, the storm had little
chance of producing a tornado. The decision was made to break off the storm
and attempt a second intercept. By this time, storms had formed along the dry
line in the Texas Panhandle. The armada headed south in Oklahoma with the idea
of entering the Texas Panhandle and intercepting one of the next two storms to
the south. Unfortunately, lack of good roads made the next two storms down the
line unsuitable for intercept. Thus, as a tornadic storm moved just north of
the only road to the northeast of Pampa (dotted line on Fig. 4), the field
teams had to turn from it and continue south.
Fig. 4). Teams gathered data on the storm for about an hour
and a half as it moved northeastward towards Gate. At that time, the field
teams determined that, despite being a strong supercell, the storm had little
chance of producing a tornado. The decision was made to break off the storm
and attempt a second intercept. By this time, storms had formed along the dry
line in the Texas Panhandle. The armada headed south in Oklahoma with the idea
of entering the Texas Panhandle and intercepting one of the next two storms to
the south. Unfortunately, lack of good roads made the next two storms down the
line unsuitable for intercept. Thus, as a tornadic storm moved just north of
the only road to the northeast of Pampa (dotted line on Fig. 4), the field
teams had to turn from it and continue south.
As this was happening, attention in the NOC turned towards identifying suitable storms that offered hope of both producing tornadoes and of crossing an area with roads. A storm south of McLean, Texas was proposed to the field coordinator as a a suitable candidate (Fig. 4). Despite being 100 km away, it appeared to be the only option and was targeted. At this time, another problem for the nowcaster arose in that field teams had become separated and the NOAA P- 3 aircraft had flown towards the target storm. As a result, communication in the field was difficult, particularly for the "Doppler on Wheels" mobile radar (Straka et al. 1996). This vehicle had to refuel more often and could not be exposed to hail. As a result, it had to be assisted towards the rest of the armada and the storm in order to recover. A third field vehicle carrying the officially-supported media crew for the week had also gotten separated. At times during the approach to the storm as it moved north of McLean, the NOC was coordinating operations on two phone lines, as well as using the third for communication with the sounding teams. Eventually, the armada intercepted the storm before 7 PM, north of McLean as it produced a violent tornado near Kellerville, Texas. The armada stayed with the storm for another two hours as it produced another violent tornado near Allison, Texas.
4. DATA ARCHIVAL
VORTEX collected large amounts of data through the various special observing systems. In addition, regularly collected operational data are of importance to VORTEX scientists. As a result, a complementary supporting data archive is available through a collaboration with UCAR's Office of Field Project Support (OFPS) in Boulder. VORTEX made extensive use of the observing networks installed as part of the NWS modernization plan. High resolution data from a number of NWS operational sources were received in near-real time at OFPS.
Digital GOES satellite imagery was transmitted, by Internet transfer, from NOAA/NSSFC to OFPS every fifteen minutes. These data include full-resolution visible, infrared, and water vapor images, as well as WSI Corp. composite radar imagery, in McIDAS format, over the VORTEX region. Additional radar data (NIDS product files, every 5 minutes and a national composite) for 12 WSR-88D radars in the VORTEX area were also collected in Boulder.
High resolution (6-sec files) upper-air soundings from 8 NWS sites were delivered to OFPS on a monthly basis. These soundings, along with the supplemental mobile and fixed CLASS sites, were quality-controlled and reformatted into a comprehensive dataset in the VORTEX archive.
Five-minute surface observations from a network of over 200 commissioned and non-commissioned ASOS and AWOS sites were routinely collected via dial-up modem. Data from the Oklahoma Mesoscale surface Network were transferred monthly to OFPS. All surface data were quality-controlled, reformatted and integrated into the 5-min surface archive.
CAPS at the University of Oklahoma produced hourly products of the regional Oklahoma Local Analysis and Prediction System (O-LAPS) using 5-min surface, radar and satellite data over the VORTEX domain. These analysis files were delivered weekly to the VORTEX archive. Additionally, NMC Eta model products (29-km grid) were collected for the 00 and 12 UTC runs from the FTP server operated at the NOAA/NMC Information Center (NIC). A catalog of the VORTEX data archive is accessible for data browsing or ordering via the Internet or the WWW at
<URL: http://www.ofps.ucar.edu/cgi-bin /codiac/projs?VORTEX>
5. ACKNOWLEDGMENTS
We want to acknowledge all those who participated in forecasting, nowcasting, satellite and sounding support for VORTEX-95. The forecasters/nowcasters included C. Crisp (NSSL), B. Johns (SPC), D. Baker, S. Corfidi, B. Kerr, R. Thompson, and M. Vescio (National Severe Storms Forecast Center), R. McCammon and M. Branick (NWSFO Norman), P. Howerton (NWSFO Wichita), A. Moller (NWSFO Fort Worth), D. Burgess (WSR-88D OSF), K. Brewster and J. Levit (CAPS), and J. McGinley (FSL). J. Moore and D. Dirks, both of OFPS, helped coordinate the sounding teams. J. Purdom, J. Weaver, K. Schrab, and R. Zehr (NOAA/ NESDIS/ORA/RAMM), P. Dills (COMET), J. LaDue (NOAA/NESDIS/ORA/PSB), G. Wade and C. Velden (CIMSS), and B. Rabin (NSSL) ran the RAMSDIS satellite system. Phillip Bothwell (SPC) provided invaluable assistance in keeping the data and report ingest systems up and running.
We thank the Unisys Corporation and Dwight Lee of Unisys, in particular, for providing the Skyvision radar display hardware and software and for keeping it running. We also thank all those at NSSL that have worked to develop the Radar Analysis Display System that we used for looking at data from the Twin Lakes, Oklahoma WSR-88D radar.
6. REFERENCES
Kanak, K. M., E. N. Rasmussen, and J. M. Straka, 1996: Mobile field coordination in VORTEX. Preprints, 18th Conf. on Severe Local Storms, San Francisco, Am. Meteor. Soc., this volume.
Rasmussen, E. N., J. M. Straka, R. Davies-Jones, C. A. Doswell III, F. H. Carr, M. D. Eilts, and D. R. MacGorman, 1994: Verification of the Origins of Rotation in Tornadoes Experiment: VORTEX. Bull. Amer. Meteor. Soc., 75, 995-1006.
Straka, J. M., J. Wurman, and E. N. Rasmussen, 1996: Observations of the low-levels of tornadic storms using a portable X-band Doppler radar. Preprints, 18th Conf. on Severe Local Storms, San Francisco, Am. Meteor. Soc., this volume.