Abstract
We have taken historical records of damage from major tornadoes in the United States and adjusted them for inflation and wealth. Such adjustments provide a more reliable method to compare losses over time in the context of significant societal change. From 1890-1999, the costliest tornado on the record, adjusted for inflation, is the 3 May 1999 Oklahoma City tornado, with an adjusted $963 million dollars in damage (constant 1997 dollars). Including an adjustment for growth in wealth, on the other hand, clearly shows the 27 May 1896 Saint Louis-East Saint Louis tornado to be the costliest on record. An extremely conservative adjustment for the 1896 tornado gives a value of $2.2 billion. A more realistic adjustment yields a figure of $2.9 billion. A comparison of the ratio of deaths to wealth-adjusted damage shows a clear break in 1953, at the beginning of the watch/warning/awareness program of the National Weather Service.
1. Introduction
Economic damage from tornadoes will tend to increase with time, in general, for at least two reasons. First, inflation means that prices of good increase, and second, except for periods of recession or depression, people and institutions have tended to acquire more wealth through time (Katz and Herman 1997). Pielke and Landsea (1998) adjusted historical hurricane damage for inflation and wealth by considering the population in the counties affected by hurricane landfall. For the tornado problem, including population information is problematic. Although a typical county is small compared to the size of a land-falling hurricane, only a small part of most counties is directly affected by even the largest tornadoes. As a result, inclusion of population in adjusting for tornado damage would properly be on a finer scale for the tornado problem. Given the difficulties of obtaining sufficiently accurate and precise tornado track and population information, we have chosen not to use population in the analysis that follows. Instead, we will consider simple methods to adjust for inflation and for wealth. The wealth measure does include the effects of population growth at a national level. However, given the variability of population demographics at the scale of tornado damage, this should be considered only a rough approximation of the effects of population changes on the normalized.
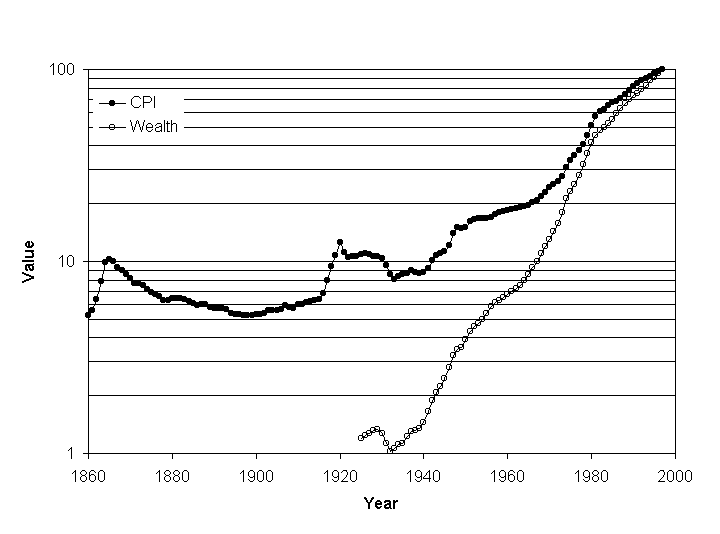
For inflation, the Consumer Price Index (CPI) provides a useful measure. It expresses the cost of goods relative to some fixed point in time (BLS 1997). In general, the CPI has been increasing since the late nineteenth century1(Fig. 1). The CPI is roughly 20 times higher than it was a century ago. We can estimate the damage in constant dollars for all events by adjusting the damage by the change in CPI between the year of the tornado and the benchmark year. 1997 was chosen as the benchmark year since that is the last year for which we have wealth information, although the choice is arbitrary. We note that Pielke and Landsea (1998) used the implicit Gross Domestic Product price deflator as their measure of inflation. In general, the GDP deflator provides a slightly lower estimate of the rate of inflation, particularly since 1980. It has the disadvantage of having a shorter period of record, with estimates going back only to 1940. As will become clear, we are interested in a number of events prior to 1940 and, although it would be possible to make an estimate of the GDP deflator prior to then by using its more recent relationship to CPI, we would like to avoid that if possible. In general, the change caused by adjusting for GDP, instead of CPI, would be 10-15% for events prior to 1980.
A measure of national wealth is the "fixed reproducible tangible wealth" (Katz and Herman 1997) (hereafter simply referred to as "wealth"). Data for this for the period 1925-1997 are available from the Bureau of Economic Analysis (BEA, 1998). It reached the $25 trillion mark in 1997. Compared to inflation, wealth has been increasing much more rapidly since 1925 (Fig. 1). Adjusted for inflation, the per capita wealth of the US has increased by a factor of 4 since 1925, according to this measure. 1997 was chosen as the benchmark year for both CPI and wealth since that's the last year for which the wealth data are available, although clearly the choice is arbitrary.
Our estimates of tornado damage up through 1995 come from Hoffman (1902) and Grazulis (1993 and personal communication). The 1999 Oklahoma City tornado is included with a $1 billion damage estimate, based on press reports after the fact. We have listed 138 tornadoes dating back to the 1890 Louisville tornado (Table 1)2. The tornadoes on the list either killed at least 20 people or had an inflation-adjusted damage total of at least $50 million in 1997 dollars, or both. The death toll restriction includes the 100 largest death tolls since 1890 and the damage restriction adds in a number of other major events with the hope that no very large events have been left out.
Based on records from the Storm Prediction
Center severe weather database, the tornadoes in the list produced
slightly over half of the total tornado damage in the period
1950-1995. Adjusted for inflation, the total damage from all
tornadoes in the period was about $19.3 billion, or a mean annual
amount of $420 million. The major tornadoes during that period in the
list here accounted for $10.2 billion, or a mean annual amount of
$220 million. These values need to viewed with some caution, because
the quality of damage estimates from individual tornadoes is variable
and annual tornado damage is highly skewed. Emphasizing this latter
point, the median annual damage is only $290 million and a quarter of
the total damage during that 46-year period occurred in four years
(1953, 1965, 1974, and 1980).
2. Inflation-adjusted damage
Adjusting only for inflation, the most damaging tornado in the record was the Oklahoma City tornado of 3 May 1999, with damage in 1997 dollars of almost $1 billion (Table 2). The title of "most-damaging tornado in US history" has changed often since 1966, when the Topeka tornado surpassed the 1896 Saint Louis tornado. Since then, tornadoes in 1970, 1975, 1979, and 1999 have taken the place of Topeka as the most expensive when adjusted for inflation. Therefore, the top thirty events are dominated by the latter part of the 1900s, with 15 occurring in 1970 or later. Only two, the Saint Louis tornadoes (1896, including the damage path in East Saint Louis, and 1927) occurred prior to 1930. Since there is no reason to believe that the meteorological aspects of tornadoes have changed, this bias towards recent times is a result of changes in what is being destroyed, just as in the hurricane case (Pielke and Landsea 1997).
3. Wealth-adjusted damage
Adjustment for wealth can be made during the 1925-1997 period in a similar manner to the inflation adjustment. Outside of this period, we must make some assumptions about the nature of the change of wealth 3. The most conservative method is to assume that the changes in wealth can be modelled by inflation. In other words, we can assume no additional goods are accumulated. This is equivalent to assuming that the gap between the CPI and Wealth curves (Fig. 1) stays constant.
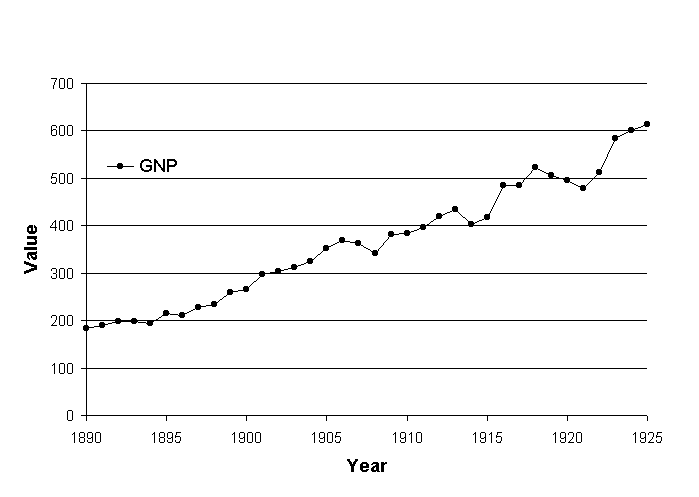
A method that is less conservative, but still requires few assumptions, for the pre-1925 period is to assume that the rate of increase in wealth followed the Gross National Product (GNP) 4 (Fig. 2). After 1997, with only the Oklahoma City tornado to consider, we have extrapolated from 1997's wealth values by assuming that the increase in wealth in 1998 and 1998 was the same as the average increase from 1990-1997, a period when the annual rate of increase was relatively consistent at a rate of 4.9%.
The 3 May 1999 Oklahoma City tornado, the most damaging when values are adjusted for inflation, is the 11th most damaging tornado in the record for wealth adjustment (Table 3), with an estimated damage of $909. (Recall that changes that result only from inflation gives a value for this event of $963 million, still in 11th place within the rankings adjusted for wealth.) Just above this, there is a tight grouping of wealth-adjusted damage values around $1.1 billion for the 4th through 10th highest damage tornadoes, with a range of $60 million. The Lorain-Sandusky, Ohio tornado of 1924 has a wealth-adjusted damage of $1.0-1.1 billion, depending on the assumptions made, placing it 10th on the list. Standing out above that tight group of tornadoes is the third-rated tornado, the 1925 Tri-State tornado, with an adjusted damage of $1.4 billion, about 20% higher than the "pack".
There are five tornadoes earlier than Lorain-Sandusky in the top thirty for which we have had to estimate the adjustment. Obviously, the earlier we look, the larger the range of values. The GNP adjustment yields a value of $589 million for the 1913 Omaha tornado and $836 million for the 1890 Louisville tornado. The GNP and inflation adjustments place the tornadoes between 13th and 16th on the list. Lower on the lists are the 1898 Fort Smith, Arkansas, and 1919 Fergus Falls, Minnesota tornadoes. There is little doubt as to where the other tornado, the 1896 Saint Louis-East Saint Louis tornado, falls on the list. The GNP adjustment gives a value of $2.9 billion. Even the most conservative adjustment, inflation-only, estimates the damage as $2.2 billion, still 20% more than the second most damaging tornado, the 1927 Saint Louis tornado, which is adjusted to $1.8 billion.
The wealth adjustment produces a list that is
more evenly distributed through time than the inflation adjustment
did. Seven of the top thirty events occurred from 1970-1999, and
eight occurred before 1930. The three highest estimates are all
associated with tornadoes prior to 1930. One of these, the Tri-State
tornado, is the biggest killer tornado in US history and was a very
long-track event with a reported path length of over 200 miles. The
other two both involve long-track, violent tornadoes going through
the downtown and industrial area of a large city, Saint Louis. Thus,
the resulting wealth-adjusted rankings seem plausible, with the
benefit of not implying a secular change in damage production since
1970.
4. Relationship of damage and death
tolls
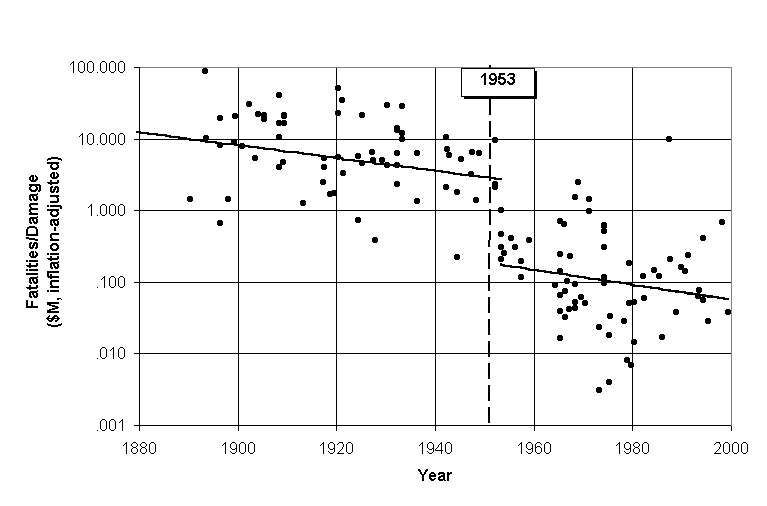
Since there is little that can be done to reduce property damage from tornadoes after a warning has been issued, we might expect that some value of normalized tornado damage would be relatively constant over time, but that warnings and public awareness might have an effect on death tolls. As a result, it is plausible that the ratio of deaths to adjusted damage would be lower with good warnings and public awareness. Doswell et al. (1999) showed a long-term decline in the number of deaths per inflation-adjusted damage (Fig. 3). The slope of the decline is a feature of interest. An equivalent analysis using wealth adjustment still shows a break in 1953, but the slope in the two periods is almost zero (Fig. 4). Given the noise in the data, there is not likely to be much meaning that can be associated with the slope after wealth adjustment. The difference in the values in the two eras (pre- and post-1953) are statistically significant at a 99.99% confidence level, using a Mann-Whitney test (Wilks 1995). This date corresponds to the beginning of the watch/warning/awareness program of the National Weather Service (Doswell et al. 1999).
The interpretation of the small slope in
Fig. 4, even if it has real meaning, is unclear. It implies
that the long-term decline seen in Fig. 3 is
due mostly to the accumulation of goods. From that prospective, the
slope in Fig.
3 corresponds to an approximation to a
wealth adjustment, i.e., inflation-adjustment with the slope removed
equals "wealth". We caution against interpreting the slope as having
any relevance to questions involving changes in warning performance
or public response. The scatter around the lines and the background
change in wealth means that a zero slope does not imply a lack of
improvement in the quality or value of watches and warnings.
5. Discussion
Comparing the amount of dollar damage between tornadoes of different eras without adjusting for the fact that values of property increase through time leads to a kind of "temporal myopia" that emphasizes only the most recent events. We have applied two different methods to adjust for era to begin to address the problem. The first involves adjusting for inflation. This still retains considerable bias towards the modern era, but starts to address the myopia.
A method that more completely adjusts for differences in era is to adjust for wealth. One result of this is that roughly the same number of high-damage tornadoes is found from 1970-1999 and prior to 1930. This is an encouraging result, in that it provides a baseline for the testing of catastrophe models that seek to estimate the likelihood of extreme events (Pielke et al. 1999). We have not considered the effects of changing population. The uncertainties associated with such effects could be very large. In order to deal with them, detailed tracks and population maps would be needed. Given that those details are lacking, we have left the population question alone.
Using wealth and inflation adjustment, it seems clear that the most damaging tornado in US history was the 1896 Saint Louis-East Saint Louis tornado, which produced damage equivalent to $2.9 billion in modern terms. This is in the range of the 30th most damaging hurricane in the Pielke and Landsea (1998) study. One way to understand this value is in comparison to the total wealth of the US. The 1896 tornado destroyed approximately 1/7000 of the total wealth of the nation. One change that has taken place in American society since that time is the "nationalization" of disaster recovery. Recovery efforts were primarily local in 1896, representing a huge burden for the local economies. Similarly, in the modern world, an event of this magnitude in a small or third world nation could have devastating effects in the absence of outside assistance.
We find nothing to suggest that damage from individual tornadoes has increased through time, except as a result of the increasing cost of goods and accumulation of wealth of the US. Long-track, violent tornadoes through the heart of major cities are extremely rare events. Two of them, the 1896 and 1927 tornadoes that struck Saint Louis, stand out as the most damaging tornadoes in the US record, with damages in modern terms of $2.9 and $1.8 billion, respectively. For comparison, the 1999 Oklahoma City tornado, which went primarily through residential areas but spent a significant portion of its path in open country, produced damage of about $0.9 billion.
The Saint Louis events provide a historical analog to possible events in modern times. Equivalent tornadoes in a major city today could produce damage that would dwarf anything that has occurred since 1930. The recovery from the Oklahoma City tornado gives a small hint as to the challenges that a similar tornado would create. The fact that such an event has not occurred since 1927 is not likely to be evidence of any changes in meteorology, but simply reflects the small area that such vulnerable parts of cities cover. The question is not if a long-track tornado through the heart of the residential and industrial portion of a major metropolitan area will occur, but when. Given urban sprawl, such an event is more likely now than in the past. It seems prudent for local governmental agencies, especially in tornado-prone regions, to estimate their vulnerability to a long-track violent tornado. The North Texas Council of Governments, including the Dallas-Fort Worth area, has recently undertaken such an exercise (NTCOG, 2000). They used the 3 May 1999 outbreak as a model and put the tornado tracks down on the Dallas-Fort Worth area. Engineers and economists then estimated the damage that would occur if the 3 May 1999 outbreak occurred in the Dallas-Fort Worth area. By moving the tornado tracks around, they were able to come up with a range of damage from both the individual tornadoes and from the outbreak. The maximum damage from a single tornado in this exercise was over $3 billion.
Finally, we speculate that the presence of the
"pack" of tornadoes with wealth-adjusted damage of around $1 billion
may be indicative of what happens when a violent tornado strikes the
heart of a moderate-size community (e.g., the 1979 Wichita Falls,
Texas or the 1924 Lorain and Sandusky, Ohio tornadoes) or hits the
suburbs of a larger city (e.g., the 1999 Oklahoma City tornado).
Devastating events with damages on the order of $1 billion or larger
have occurred about once per decade in the US. During that period,
gaps of 20 years between successive events have occurred, as well as
clusters of events in much shorter time, as would be expected from
any random distribution of events. A major challenge to preparedness
and recovery is maintaining a level of readiness during the gaps.
Catastrophic events pose significant threats to the insurance and
reinsurance industries (Keller 2000). Thus, accurate estimates of the
threat are important for long-term planning both in the private and
public sectors.
Acknowledgments:
We thank Tom Grazulis for providing estimates
of damage from historical tornadoes, and Roger Pielke, Jr. for
suggesting the wealth adjustment and pointing out the location of the
appropriate economic data. Chris Landsea and Roger Pielke, Jr.
provided insightful comments that improved the manuscript.
References
BEA (Bureau of Economic Analysis), 1998: Tangible wealth. (Available from BEA Order Desk, Bureau of Economic Analysis, BE-53, U.S. Department of Commerce, Washington, DC 20230, Number NDN-0216, or on-line at <URL:http://www.bea.doc.gov/bea/uguide.htm> in Windows format.)
BLS (Bureau of Labor Statistics), 1997: BLS Handbook of Methods. (Available from Bureau of Labor Statistics, Publications Sales Center, P.O. Box 2145, Chicago, IL 60690, or on-line at <URL: http://stats.bls.gov/opub/hom/homhome.htm.>)
Doswell III, C. A., A. R. Moller, and H. E. Brooks, 1999: Storm spotting and public awareness since the first tornado forecasts of 1948. Wea. Forecasting, 14, 544-557.
Grazulis, T. P., 1993: Significant tornadoes, 1680-1991. St. Johnsbury, VT, Environmental Films, 1326 pp.
Hoffman, F. L., 1902: Windstorm and Tornado Insurance. New York, The Spectator Co., 50 pp.
Katz, A. J., and S. W. Herman, 1997: Improved estimates of fixed reproducible tangible wealth, 1929-95. Survey of Current Business, May 1997, 69-92.
Keller, J. L., 2000: Extreme weather events and the insurance industry: Opportunities and challenges for the atmospheric sciences community. Preprints, Second Symposium on Environmental Applications, Amer. Meteor. Soc., Long Beach, California, 208-211.
NTCOG (North Texas Council of Governments), 2000: Tornado damage risk assessment. Dallas-Fort Worth Metroplex. [Available from North Texas Council of Governments , 616 Six Flags Drive, Suite 200, Centerpoint Two, P.O. Box 5888, Arlington, TX 76005-5888.]
Office of the President, 2000: Economic report of the President. U.S. Government Printing Office, Washington, D.C.
Pielke, R. A., Jr., and C. W. Landsea, 1998: Normalized hurricane damages in the United States, 1925-1995. Wea. Forecasting, 13, 621-631.
_____ and _____, R. T. Musulin, and M. Downton, 1999: Evaluation of catastrophe models using a normalized historical record. Why it is needed and how to do it. J. Insurance Regulation, 18(2), 177-194.
Wilks, D. S., 1995: Statistical Methods in the Atmospheric
Sciences. New York, Academic Press,
467. pp.
Table 1: Tornadoes in dataset. Location is the city or area most affected by the tornado. Dead is number killed and Damage is unadjusted damage at time of tornado in millions of dollars.
|
|
|
|
|
|
|
|
|
|
|
|
|
|
|
|
|
|
|
|
|
|
|
|
|
|
|
|
|
|
|
|
|
|
|
|
|
|
|
|
|
|
|
|
|
|
|
|
|
|
|
|
|
|
|
|
|
|
|
|
|
|
|
|
|
|
|
|
|
|
|
|
|
|
|
|
|
|
|
|
|
|
|
|
|
|
|
|
|
|
|
|
|
|
|
|
|
|
|
|
|
|
|
|
|
|
|
|
|
|
|
|
|
|
|
|
|
|
|
|
|
|
|
|
|
|
|
|
|
|
|
|
|
|
|
|
|
|
|
|
|
|
|
|
|
|
|
|
|
|
|
|
|
|
|
|
|
|
|
|
|
|
|
|
|
|
|
|
|
|
|
|
|
|
|
|
|
|
|
|
|
|
|
|
|
|
|
|
|
|
|
|
|
|
|
|
|
|
|
|
|
|
|
|
|
|
|
|
|
|
|
|
|
|
|
|
|
|
|
|
|
|
|
|
|
|
|
|
|
|
|
|
|
|
|
|
|
|
|
|
|
|
|
|
|
|
|
|
|
|
|
|
|
|
|
|
|
|
|
|
|
|
|
|
|
|
|
|
|
|
|
|
|
|
|
|
|
|
|
|
|
|
|
|
|
|
|
|
|
|
|
|
|
|
|
|
|
|
|
|
|
|
|
|
|
|
|
|
|
|
|
|
|
|
|
|
|
|
|
|
|
|
|
|
|
|
|
|
|
|
|
|
|
|
|
|
|
|
|
|
|
|
|
|
|
|
|
|
|
|
|
|
|
|
|
|
|
|
|
|
|
|
|
|
|
|
|
|
|
|
|
|
|
|
|
|
|
|
|
|
|
|
|
|
|
|
|
|
|
|
|
|
|
|
|
|
|
|
|
|
|
|
|
|
|
|
|
|
|
|
|
|
|
|
|
|
|
|
|
|
|
|
|
|
|
|
|
|
|
|
|
|
|
|
|
|
|
|
|
|
|
|
|
|
|
|
|
|
|
|
|
|
|
|
|
|
|
|
|
|
|
|
|
|
|
|
|
|
|
|
|
|
|
|
|
|
|
|
|
|
|
|
|
|
|
|
|
|
|
|
|
|
|
|
|
|
|
|
|
|
|
|
|
|
|
|
|
|
|
|
|
|
|
|
|
|
|
|
|
|
|
|
|
|
|
|
|
|
|
|
|
|
|
|
|
|
|
|
|
|
|
|
|
|
|
|
|
|
|
|
|
|
|
|
|
|
|
|
|
|
|
|
|
|
|
|
|
|
|
|
|
|
|
|
|
|
|
|
|
|
|
|
|
|
|
|
|
|
|
|
|
|
|
|
|
|
|
|
|
|
|
|
|
|
|
|
|
|
|
|
|
|
|
|
|
|
|
|
|
|
|
|
|
|
|
|
|
|
|
|
|
|
|
|
|
|
|
|
|
|
|
|
|
|
|
|
|
|
|
|
|
|
|
|
|
|
|
|
|
|
|
|
|
|
|
|
|
|
|
|
|
|
|
|
|
|
|
|
|
|
|
|
|
|
|
|
|
|
|
Table 2: Thirty most damaging tornadoes in United States (1890-1999) adjusted for inflation. Location is the city or area most affected by the tornado. "Raw" is the raw damage amount in dollars and "Adjusted" is the amount adjusted to 1997 dollars. T indicates tie in rank.
|
|
|
|
|
| |
|
|
|
|
|
| |
|
|
|
|
|
| |
|
|
|
|
|
| |
|
|
|
|
|
| |
|
|
|
|
|
| |
|
|
|
|
|
| |
|
|
|
|
|
|
|
|
|
|
|
|
|
|
|
|
|
|
|
| |
|
|
|
|
|
| |
|
|
|
|
|
| |
|
|
|
|
|
|
|
|
|
|
|
|
| |
|
|
|
|
|
| |
|
|
|
|
|
| |
|
|
|
|
|
| |
|
|
|
|
|
| |
|
|
|
|
|
| |
|
|
|
|
|
|
|
|
|
|
|
|
| |
|
|
|
|
|
| |
|
|
|
|
|
| |
|
|
|
|
|
| |
|
|
|
|
|
| |
|
|
|
|
|
| |
|
|
|
|
|
| |
|
|
|
|
|
| |
|
|
|
|
|
| |
|
|
|
|
|
| |
|
|
|
|
|
| |
Table 3: Thirty most damaging tornadoes in United States (1890-1999) adjusted for wealth. Italicized events occurred outside the range of the wealth data. First value under "Adjusted" assumes that all wealth changes before 1925 can be modelled using changes in the Gross National Product and after 1997 can be modelled using the rate of increase from 1990-1997. The parenthetical value models wealth changes by assuming that all wealth changes before 1925 and after 1997 can be modelled just with inflation.
|
|
|
|
|
|
|
|
|
|
|
|
|
|
|
|
|
|
|
|
|
|
|
|
|
|
|
|
|
|
|
|
|
|
|
|
|
|
|
|
|
|
|
|
|
|
|
|
|
|
|
|
|
|
|
|
|
|
|
|
|
|
|
|
|
|
|
|
|
|
|
|
|
|
|
|
|
|
|
|
|
|
|
|
|
|
|
|
|
|
|
|
|
|
|
|
|
|
|
|
|
|
|
|
|
|
|
|
|
|
|
|
|
|
|
|
|
|
|
|
|
|
|
|
|
|
|
|
|
|
|
|
|
|
|
|
|
|
|
|
|
|
|
|
|
|
|
|
|
|
|
|
|
|
|
|
|
|
|
|
|
|
|
|
|
|
|
|
|
|
|
|
|
|
|
|
|
|
|
|
|
|
|
|
|
|
Figure Captions
Fig. 1: Consumer Price Index (CPI) (solid circles) from 1860-1997 and Fixed Reproducible Tangible Wealth (Wealth) (open circles) from 1925-1997 in United States (1997 index value = 100). Logarithmic scale.
Fig. 2: Gross National Product (GNP) in billions of dollars from 1890-1925.
Fig. 3: Fatalities per million dollars damage (adjusted for inflation to 1997) for each of the major tornadoes since 1880, on log scale. Solid lines represent least squares fit to data before and after 1953, indicated by dashed line. (Adapted from Doswell et al. 1999.)
Fig. 4: Same as Fig. 3 except adjusted for wealth.