Daily Lightning Maps - Central Arizona - July
and August 1995 to 1999
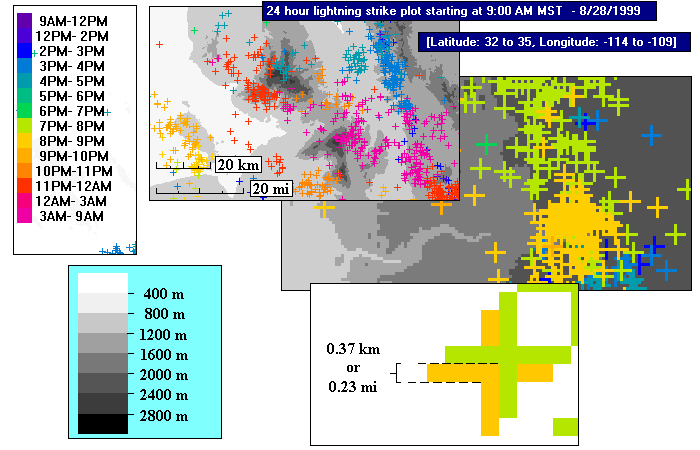
The calendar below, contains links to daily lightning strike maps for
central Arizona. The region covered extends in a rectangle from latitude
32 N to 35 N and longitude 109 W to 114 W [(463 km x 278 km) or (288 mi
x 173 mi)]. This is roughly centered on the Phoenix radar.
The strikes are color coded for the time of day, with the color changing
every hour during most of the time when storms are typically active (see
figure below for actual scale). The 24 hour time period chosen does
not match a calendar day, but is instead chosen to be more of a 'storm
day'. 9:00 AM MST was chosen as the dividing line from one storm
day to the next, since this is about at the average nadir of lightning
activity. Certainly this choice, as opposed to using a midnight dividing
line, will be much less likely to spread the same storm onto two different
maps. The grey scale background shows the topography with the contour
values shown. The resolution is quite fine, but multiple strikes
are often close enough that they plot on top of each other and that is
not indicating in anyway on the plots. In order for two strikes to
plot on top of each other, they must have the same position to within about
a quarter of a mile, which is somewhat less than the uncertainty in the
strike locations themselves.
July 1997
August 1997
July 1998
August 1998
July 1999
August 1999