NSSL researcher answers the question: "When and where
does severe weather occur?"
...continued
Severe Thunderstorm Climatology Data Sections
 The
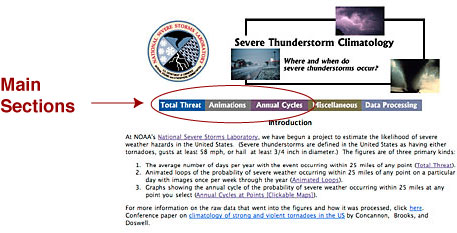
web site has three main data sections.
Total Threat contains images of the total annual threat for tornadoes, wind, and hail for the continental U.S.
Animations contains similar maps for the same categories, but each map is for a specific week during the year. This section of the web site allows you to see how the threat of various types of weather typically moves around through the U.S. as the seasons change.
Annual Cycles was explained on the previous page and allows you to see a graph of annual cycle of the probability of tornadoes, wind, and hail for a particular spot.
The remaining two buttons, Miscellaneous and Data Processing explain other aspects of the data:
Miscellaneous includes:
- how reports have changed over time
- the date on which the maximum threat for severe weather is
- monthly probabilities
- variability in the data
Data Processing explains what datasets were used as well as how and why data processing decisions were made.
Example: Total threat
This section of the web site has maps of the total annual threat for any severe weather as well as maps of "high end" severe weather. Any severe weather includes the chance of any strength of tornado, wind greater than 50 kts, or hail at least 3/4 inches in diameter. "High-End Severe Weather" is defined as the chances of tornadoes at least F2 in strength, winds greater than 65 kts, or hail at least 2 inches in diamater. Below is how to interpret these maps. Data always refer to the chances within 25 miles of a point.
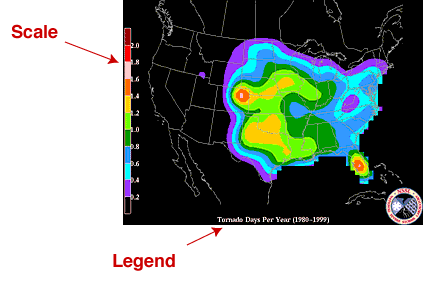
Each map has a scale and legend explaining what the map is. The scale refers to the number of days per period of time explained in the legend that the type of weather specified in the legend might occur. The example to the right is the map for "Any Tornado" for the period "1980-1999." The scale refers to the number of days per year a tornado might occur within 25 miles of a point. Here is a link to the full size map. |

|
How the NOAA Storm Prediction Center is using our work:
The NOAA Storm Prediction Center's daily Probabilistic Outlooks, based on
the above work:
http://www.spc.noaa.gov/products/outlook/day1otlk.html ![]()
More information about the probabilistic outlooks is available here:
http://www.spc.noaa.gov/products/outlook/probinfo.html ![]()